Wednesday, 21 June 2017
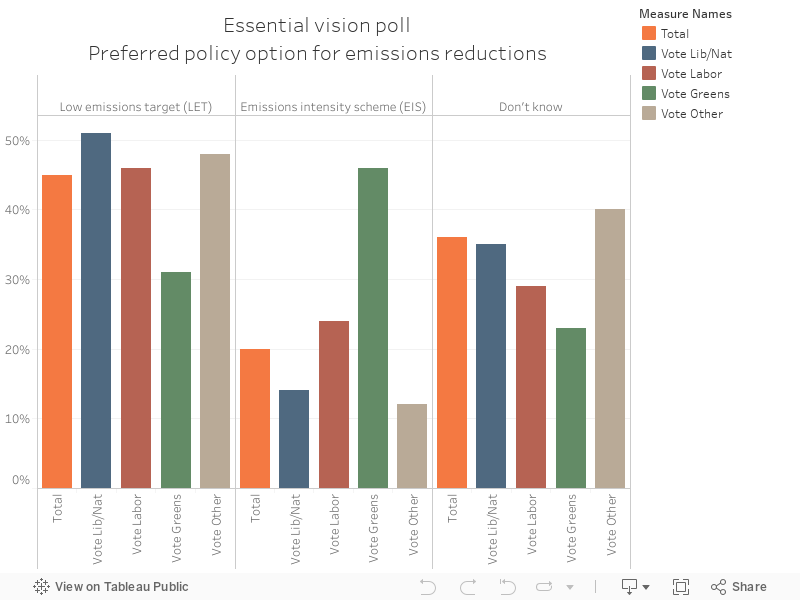
065 - The public like a clean energy target (but are still confused about it all)
Essential Vision polled survey respondents on their views about a clean energy target scheme and an emissions intensity scheme - people like a CET but there's plenty of don't knows about both.
Tuesday, 20 June 2017
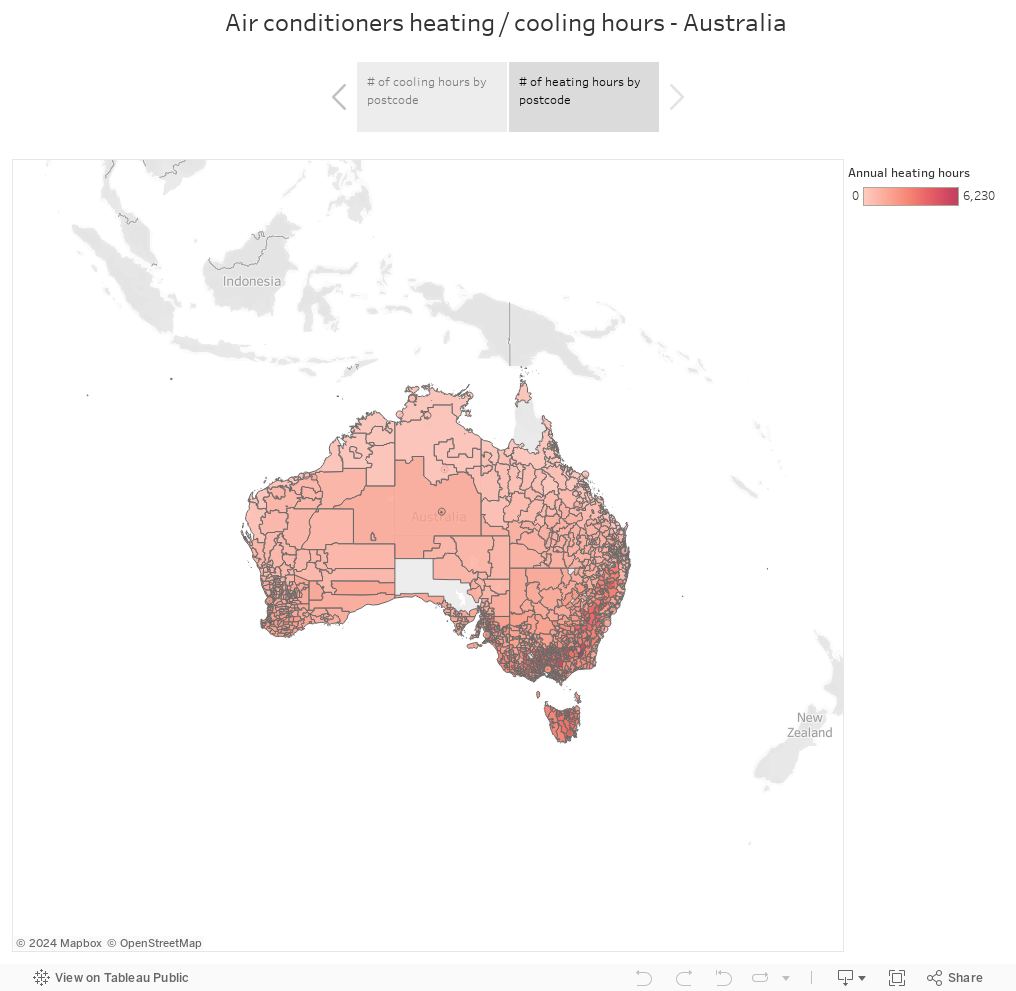
064 - Australian air-conditioner usage map
This great data set shows total hours of cooling and heating in Australia over the course of a year, available here. Its sorted by postcode, so I've made them into a map below.
Monday, 19 June 2017
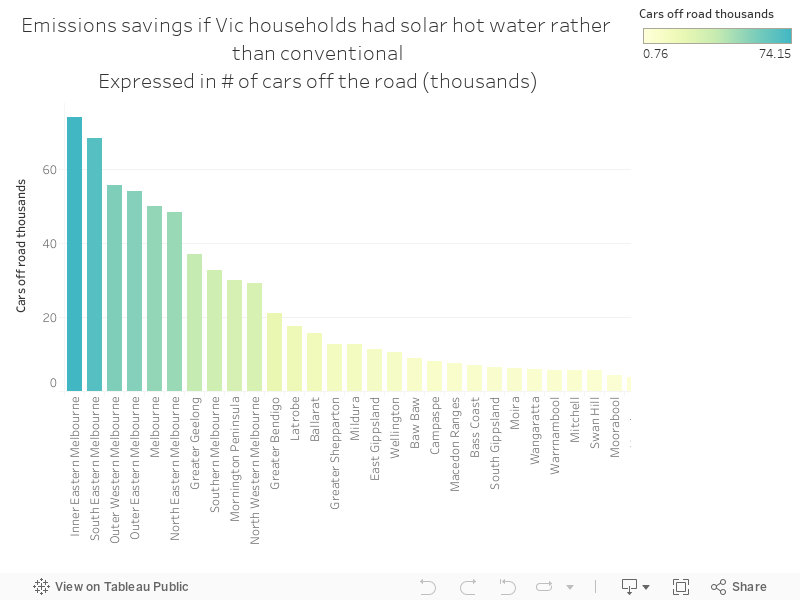
063 - Emissions reductions potential from Vic hot water
More data from Aus gov's great open data site - "Using data from the Bureau of Meteorology and figures from the Climate Group, the Solar Report shows the percentage cost and greenhouse gas emissions that households in Victorian regions would save on their hot water bill if they had a solar water heater"
The chart below shows emissions reductions in the total number of cars that could be taken off the road.
The chart below shows emissions reductions in the total number of cars that could be taken off the road.
Sunday, 18 June 2017
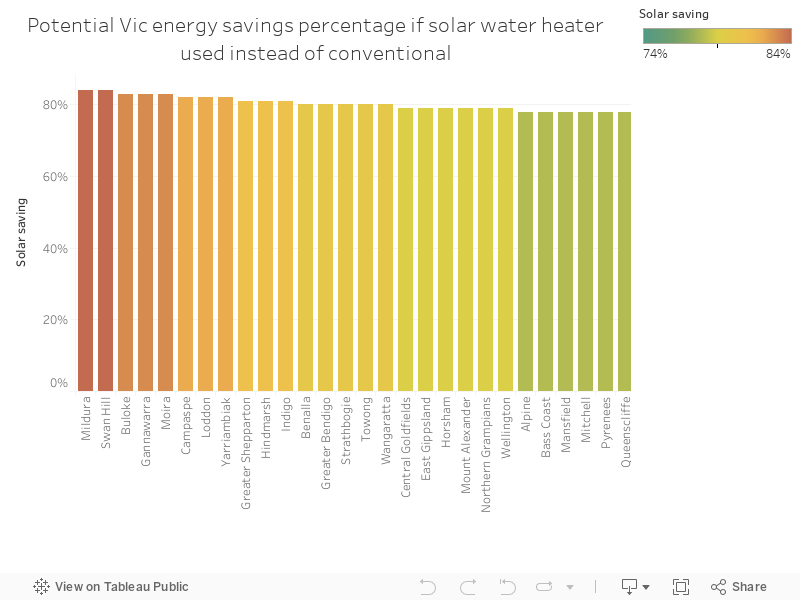
062 - The potential savings from new solar hot water in Victoria
More data from Aus gov's great open data site - "Using data from the Bureau of Meteorology and figures from the Climate Group, the Solar Report shows the percentage cost and greenhouse gas emissions that households in Victorian regions would save on their hot water bill if they had a solar water heater"
Go Mildura!
Go Mildura!
Thursday, 15 June 2017
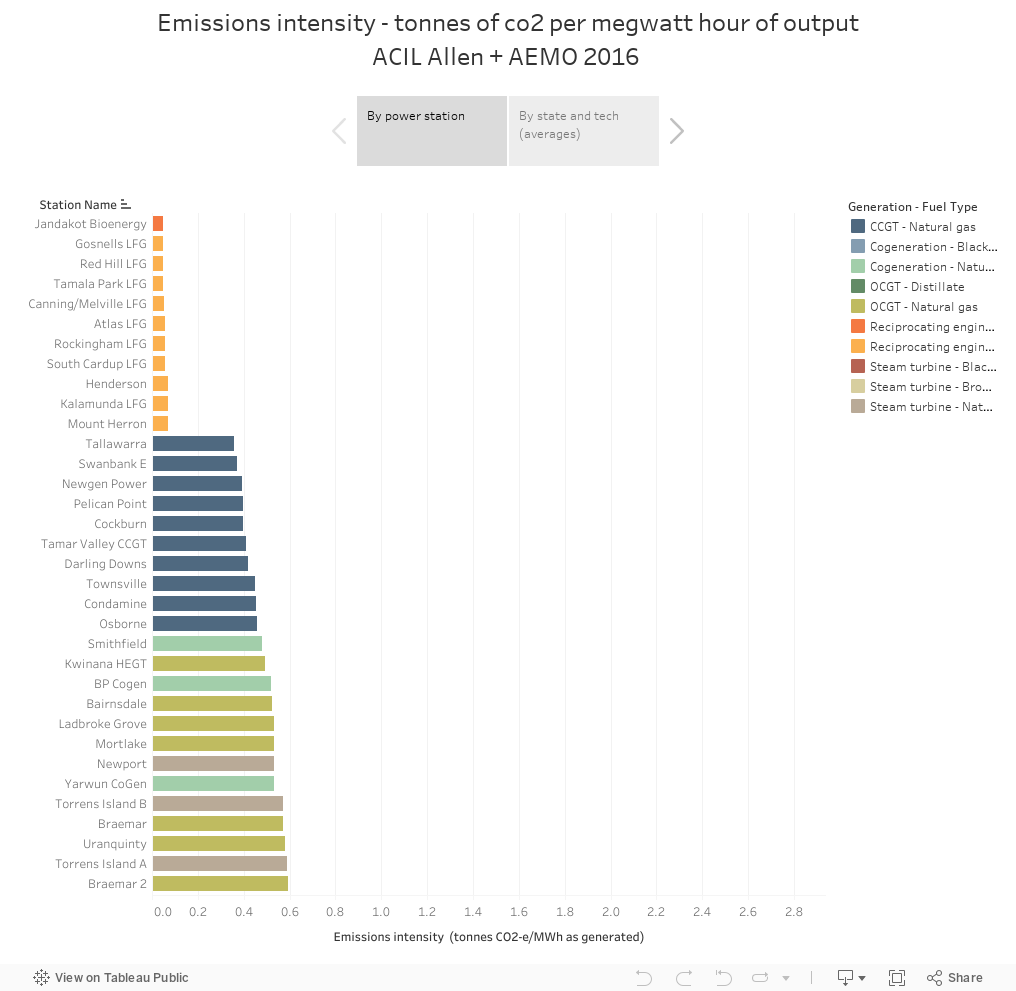
061 - Emissions intensity of new NEM generators
The Australian Electricity Market Operator has a database called the National Transmission Network Development Plan (NTNDP) database - the NTNDP is basically a report that looks at what future grid wires might look like. There are some detailed, fascinating data points underneath this report.
The chart below shows emissions intensity for new power stations - measured in the tonnes of greenhouse gases emitted for every megawatt hour of generation.
The chart below shows emissions intensity for new power stations - measured in the tonnes of greenhouse gases emitted for every megawatt hour of generation.
Wednesday, 14 June 2017
060 - Thermal efficiency
The Australian Electricity Market Operator has a database called the National Transmission Network Development Plan (NTNDP) database - the NTNDP is basically a report that looks at what future grid wires might look like. There are some detailed, fascinating data points underneath this report.
The chart below shows the thermal efficiency for new power stations in Australia - it's measured in HHV - "High heating value". This is, basically, how much you get out, relative to what you put in.
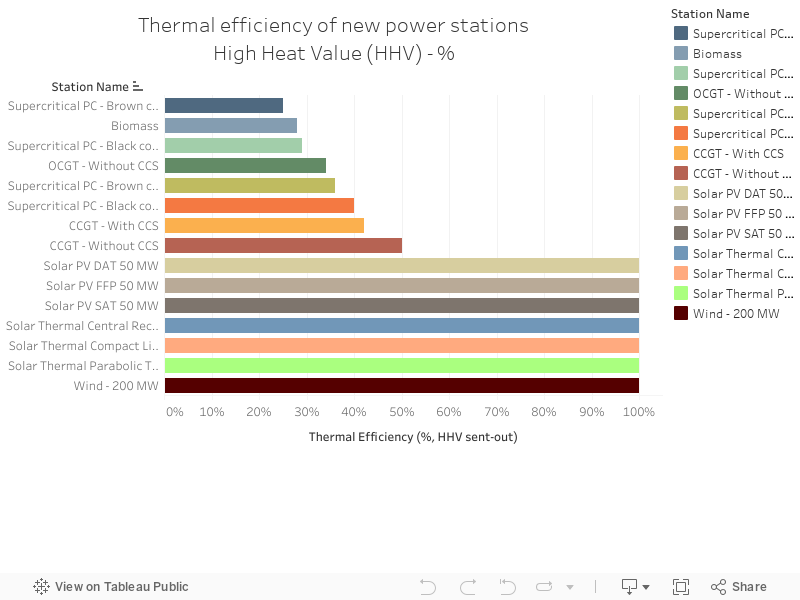
The chart below shows the thermal efficiency for new power stations in Australia - it's measured in HHV - "High heating value". This is, basically, how much you get out, relative to what you put in.
Tuesday, 13 June 2017
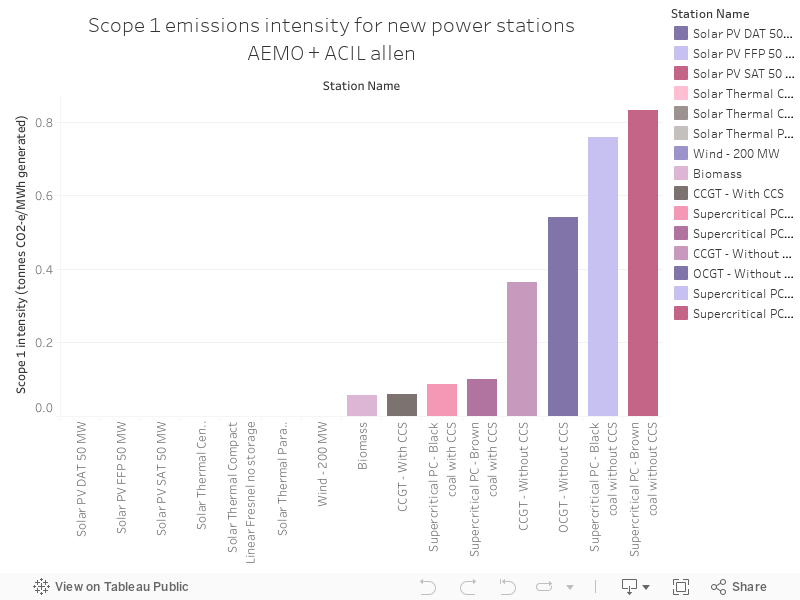
059 - Scope 1 emissions intensity for
The Australian Electricity Market Operator has a database called the National Transmission Network Development Plan (NTNDP) database - the NTNDP is basically a report that looks at what future grid wires might look like. There are some detailed, fascinating data points underneath this report.
The chart below shows emissions intensity - the numbers of tonnes of greenhouse gases that are emitted for every megawatt hour of generation from power stations - by state, and by individual power plants.
The chart below shows emissions intensity - the numbers of tonnes of greenhouse gases that are emitted for every megawatt hour of generation from power stations - by state, and by individual power plants.
Subscribe to:
Posts (Atom)