Saturday, 2 September 2017

127 - Avg percent by month and hour

I measured battery statistics on my Android Nexus 6P for a few months, using 3C Battery monitor widget.

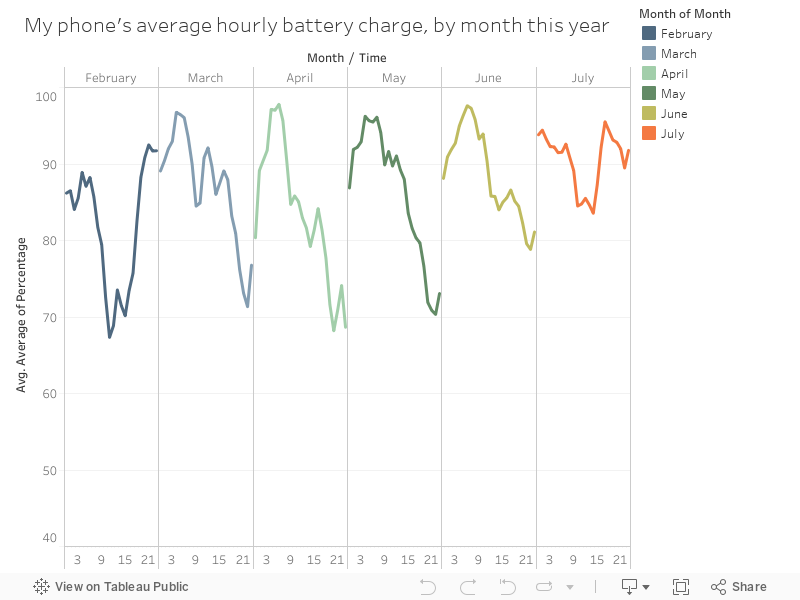
The chart below shows my average hourly battery percentage state, split out by month this year (I seem to be getting more paranoid about battery charge as the year goes on.....working from home for half of June and all of July is the cause of this, really)


126 - Average battery percentage, daily (Jan to August)

I measured battery statistics on my Android Nexus 6P for a few months, using 3C Battery monitor widget.

The chart below shows the average percentage battery charge state by hour, from Jan to Aug.


125 - Battery drain - daily average (Jan to August)

I measured battery statistics on my Android Nexus 6P for a few months, using 3C Battery monitor widget.

The chart below shows the average drain or charge on my battery my by hour, from January to August, by hour of day.


124 - Brisbane to Sydney flight speed map

A map showing a flight from Brisbane to Sydney, with the colour indicating altitude


123 - Uphill climb - Barrington Tops

A map of a walk up a giant hill in Barrington Tops, NSW, showing altitude as the colour

122 - Drive to Vincentia - mobile signal strength map

A map of a drive to Vincentia (with the start and end chopped off), showing mobile phone signal strength. I'm on Vodafone.


121 - Drive to Vincentia - Speed map

A map of a drive to Vincentia, showing average speed, with the start and end of the journey lopped off.