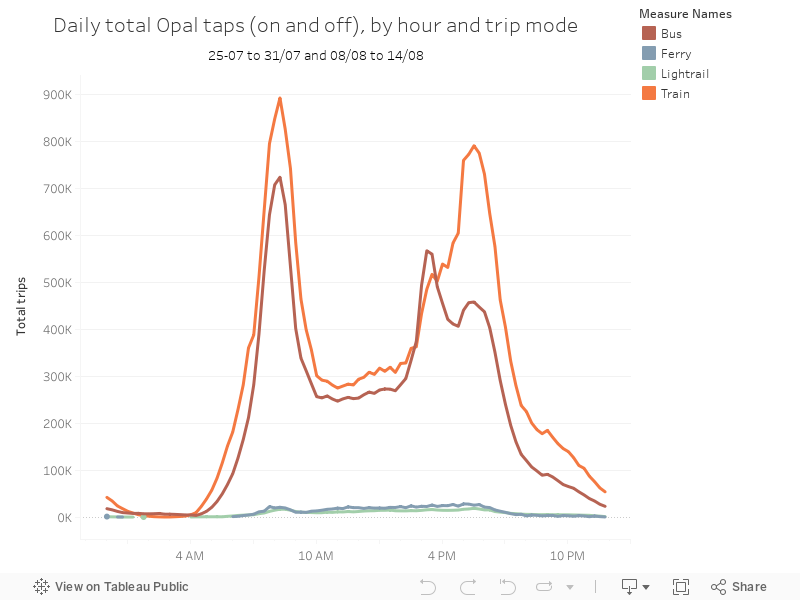
This series is a big, huge, wonderful batch of
Opal card data from two very limited time periods and completely anonymised using a range of techniques, from the NSW Open Data portal. You have to sign up to NSW Open Data to get copies, but it's worth it, it's quite interesting.
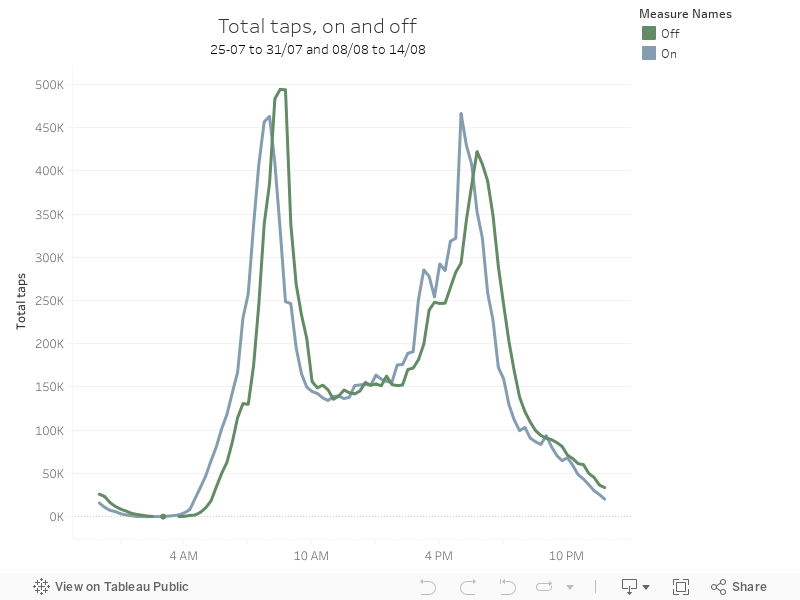
The data below show taps on vs taps off, showing the start and end of journeys by hour, only for trains