As part of a recent blog
post, I gathered up a bunch of
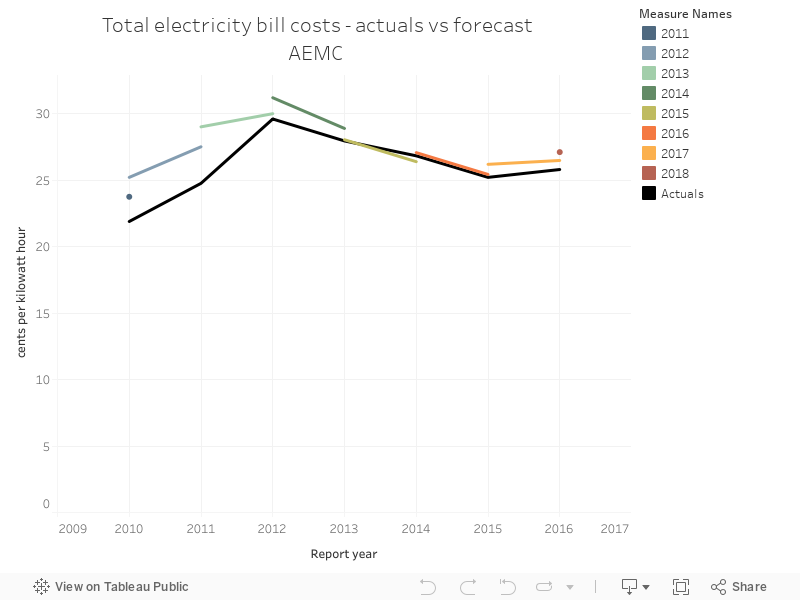
data from the Australian Energy Markets Commission's analysis of Australian electricity bills. These charts are an expansion of that analysis.
The chart below shows what the forecasted value for the total bill cost, in cents per kilowatt hour was in the two years leading up to a year, alongside what the actual value for that year was.
No comments:
Post a Comment