Charts 106 through to 115 will be a series based on data from the United States Energy Information administration, with 108 to 115 focusing on solar thermal power stations in the US (South Australia just had an announcement about a big new
solar thermal power station).
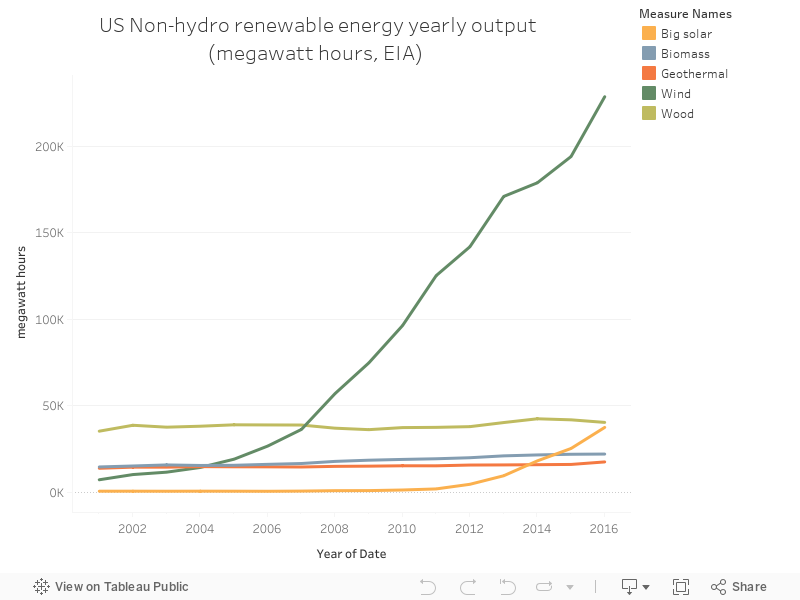
Today's chart shows the yearly output of US' non-hydro renewable power stations - with wind and big solar being to big standouts in terms of increases
No comments:
Post a Comment