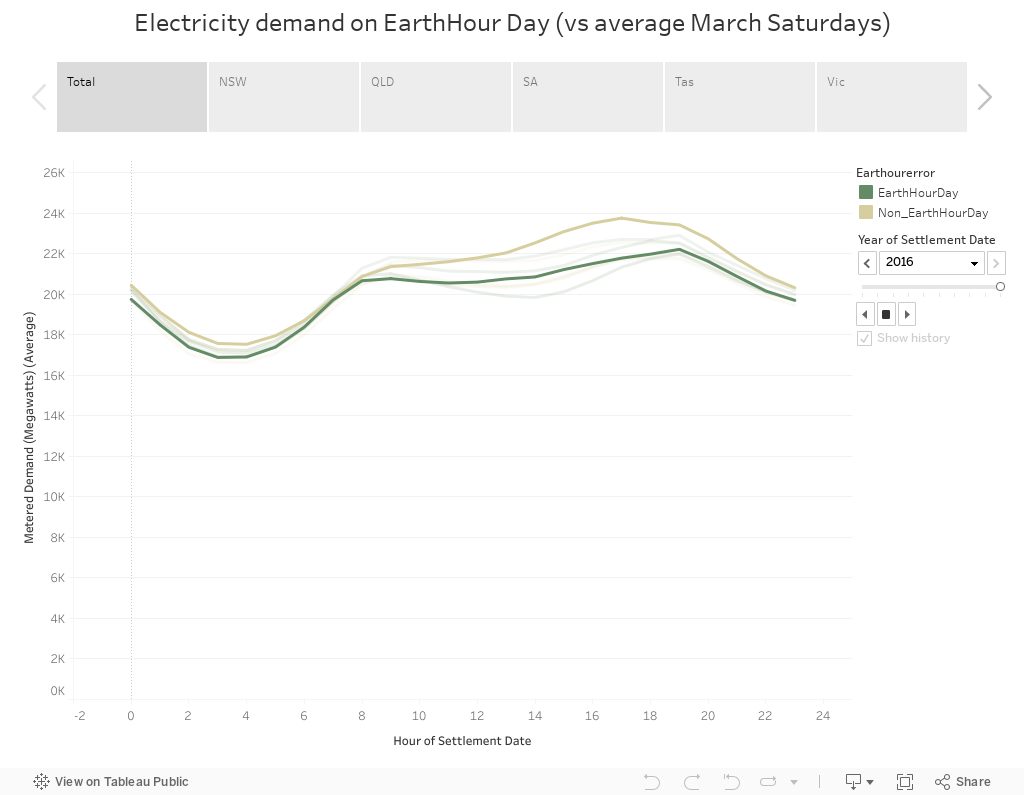
The chart below shows demand, either by total for the NEM or state-by-state, for each earth-hour day in those past ten years, compared to the average March Saturday for that year. In some instances, total demand during the day is lower than the average - but impact on demand during the designated hour is usually hard to detect - which reinforces the symbolic nature of the event. Data via NEM-Review.
No comments:
Post a Comment