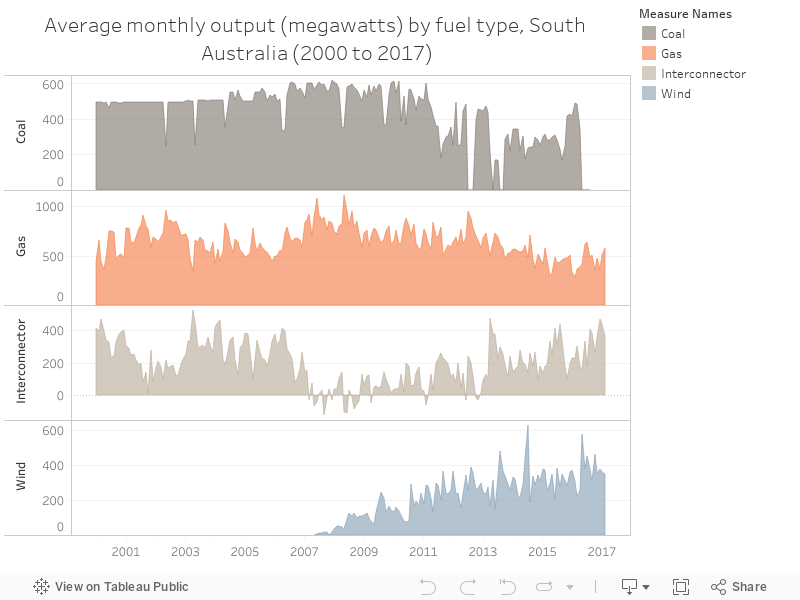
A simple chart below showing the average monthly output of South Australia sources of electricity, in megawatts, for the decade and a half (ish) - notable for the decline of coal, upswing of wind and up and down of interconnector flows. Source -
NEM-Review.
No comments:
Post a Comment