
Thursday, 30 March 2017
010 - Sunrise and sunset in Sydney, through the year
A relatively simple one - sunrise and set, and associated twilight times throughout the year. It's just pretty :) Source.
Wednesday, 29 March 2017
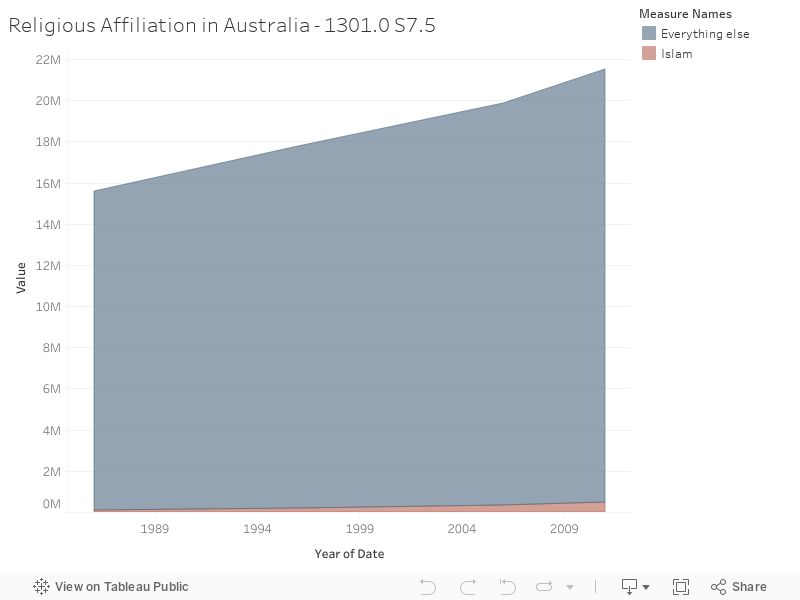
009 - Islam isn't swamping Australia: religious affiliation in Australia
Tuesday, 28 March 2017
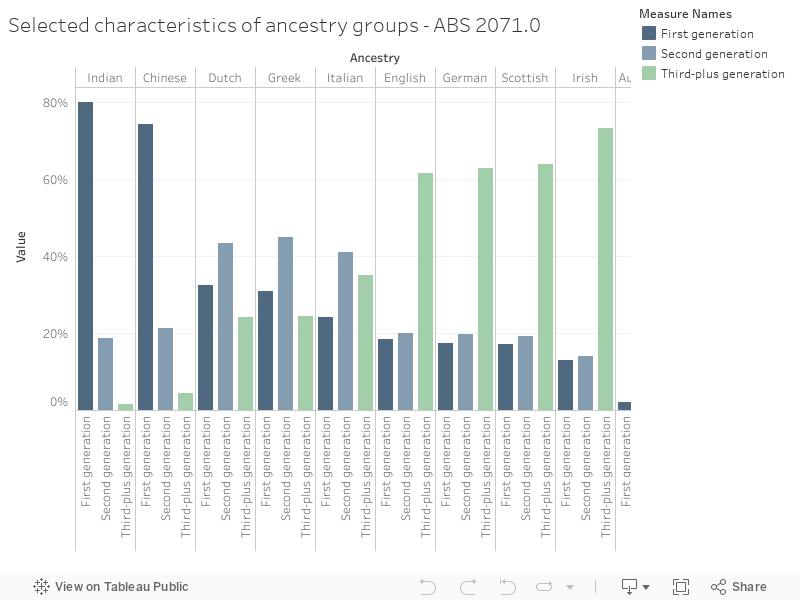
008 - Immigration looks different, compared to a few decades back
Immigration is an increasingly prominent issue in Australian politics - the chart below shows first generation Australians (those born overseas) skew towards Indian and China, whereas second and third generation Australian skew towards European countries. Source - ABS.
Monday, 27 March 2017
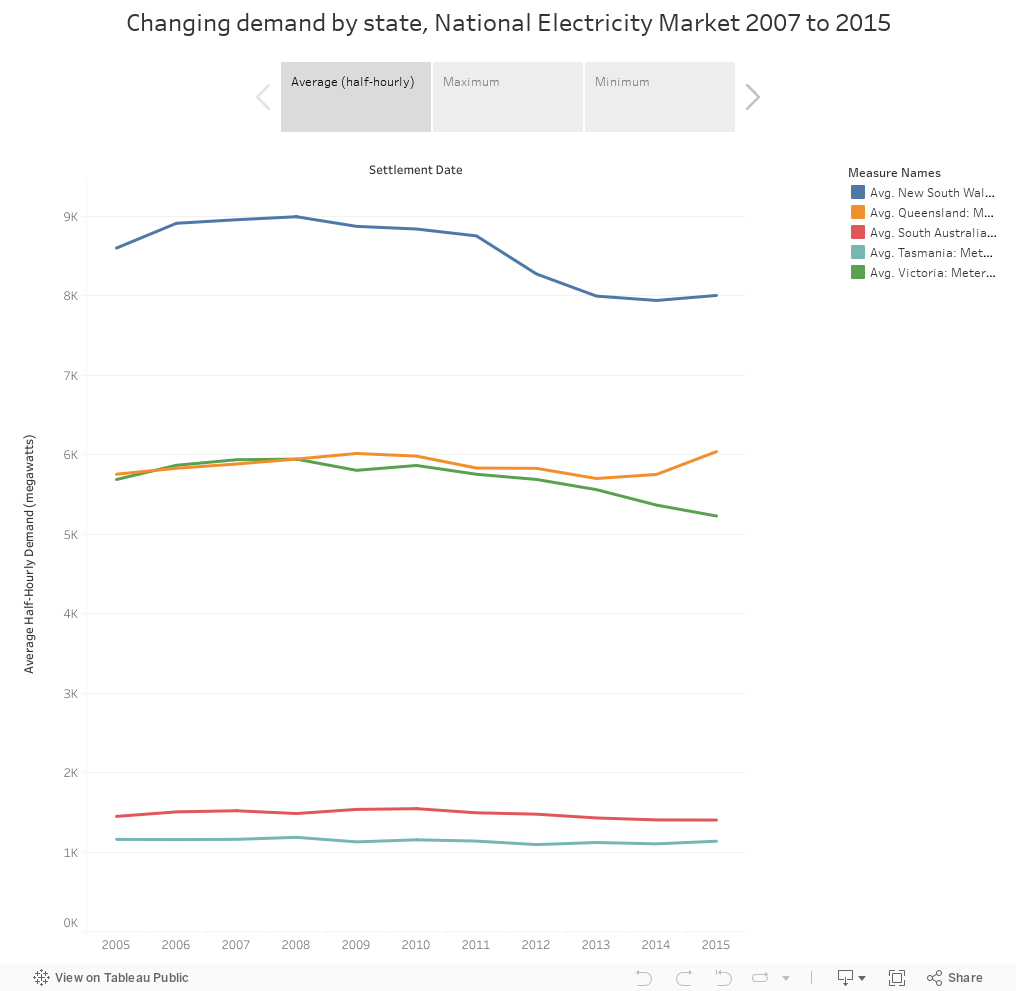
007 - Decreasing demand in the National Electricity Market - but peaks haven't changed that much
How has demand changed in the Australian NEM over the past few years? The chart below splits that up by state, and includes minimum and maximum half-hourly demand for each year. Read the market operator's demand forecasting report here - data below via NEM-review, Demand is down, but the maximums haven't changed to quite the same degree.
Sunday, 26 March 2017
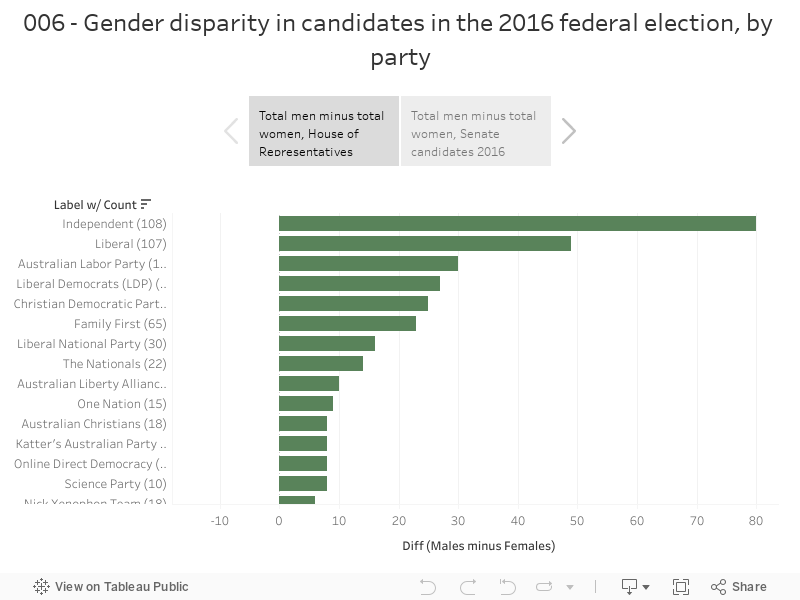
006 - There's a really huge gender disparity in candidates for the 2016 federal election
The Australian Electoral Commission make gender distribution data freely available on their website - it shows a stark and irritatingly simple picture of how candidates presented for almost all parties skew towards men rather than women. Brackets next to party names show the total number of candidates. Source
Thursday, 23 March 2017
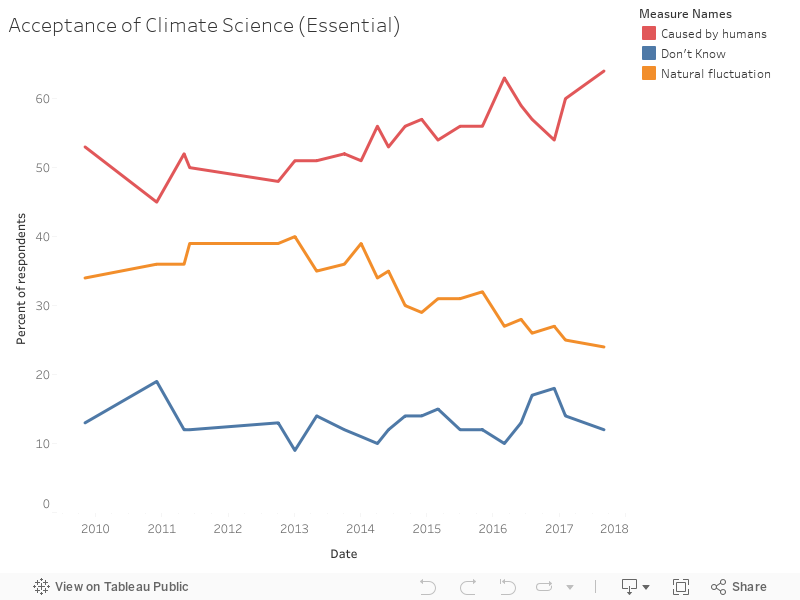
005 - Acceptance of climate science
There's a confluence of scientific opinion, when it comes to climate change - the vast majority of climate scientists concur humans have a serious impact on the climate. Public opinion doesn't quite match this consensus, though, as Essential's long-running survey illustrates.
Wednesday, 22 March 2017
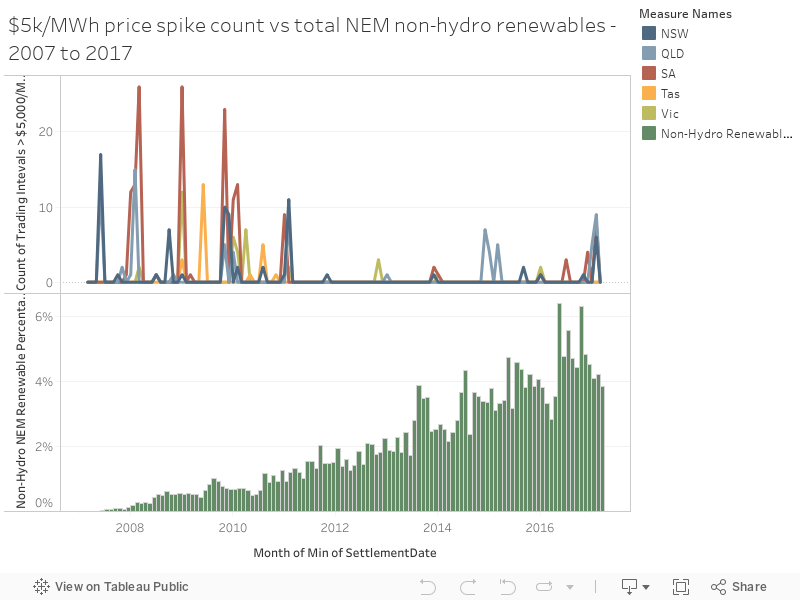
004 - Price Spikes vs RE Power percentage
There's been plenty of coverage of electricity prices and regional electricity issues - I thought I'd draw up the number of price spikes where trading interval (half-hour average price) was above $5,000 per megawatt hour over the past decade (ish), and compare it to the (still relatively small) penetration of non-hydro renewable (solar, wind) in the National Electricity Market. (Data extracted from the excellent NEM-Review software)
Tuesday, 21 March 2017
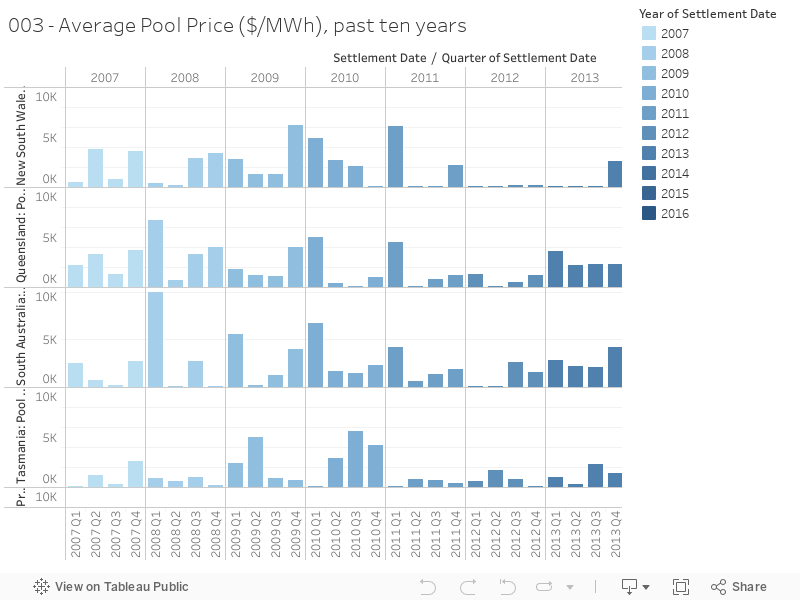
003 - NEM Pool prices over the past ten years
Wholesale electricity price, just one component of many that make up your retail bill, is separate for each region in the National Electricity Market - the chart below shows average quarterly pool price over the past yen years. Courtesy of NEM-Review.
Monday, 20 March 2017
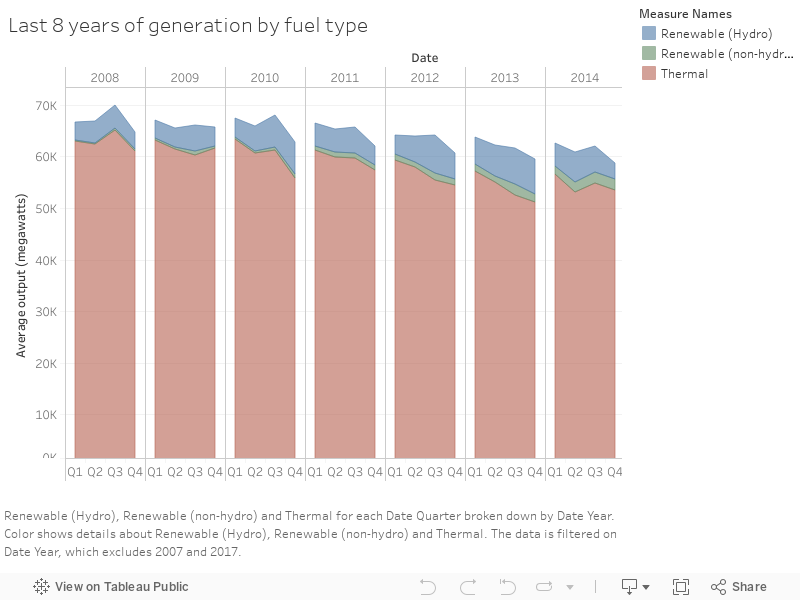
002 - Changes in NEM generation over the past ten years (ish)
Chart number two - showing how total power output on the National Electricity Market has decreased, and how a sliver of wind and solar are adding to hydro in pushing down the output of thermal generation. Data courtesy of Nem Review.
Monday, 6 March 2017
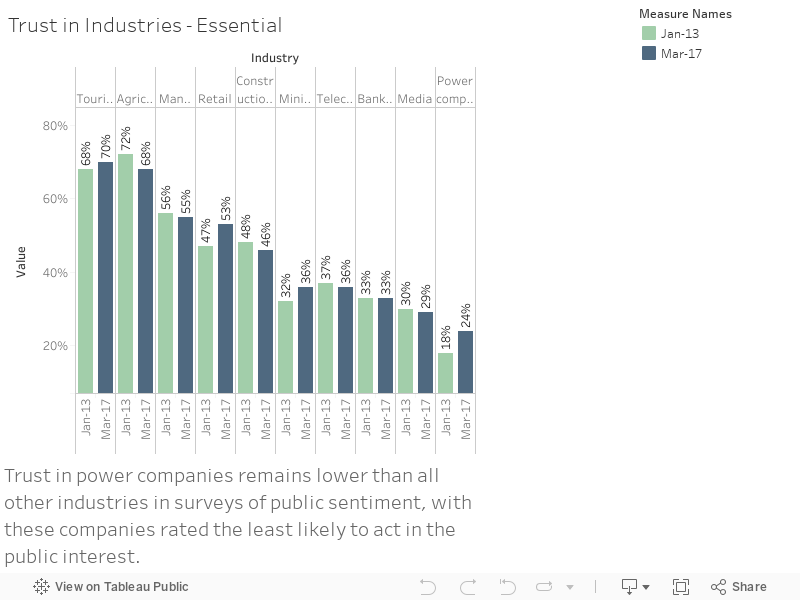
001 - Trust in power companies
First chart! A new Essential poll finds that power companies are the least trusted among a range of industries - it's a bit up from 2013, but still really quite a fair bit lower than other industries, including the mining industry. Source.
Subscribe to:
Posts (Atom)