Showing posts with label Fuel. Show all posts
Showing posts with label Fuel. Show all posts
Monday, 23 October 2017
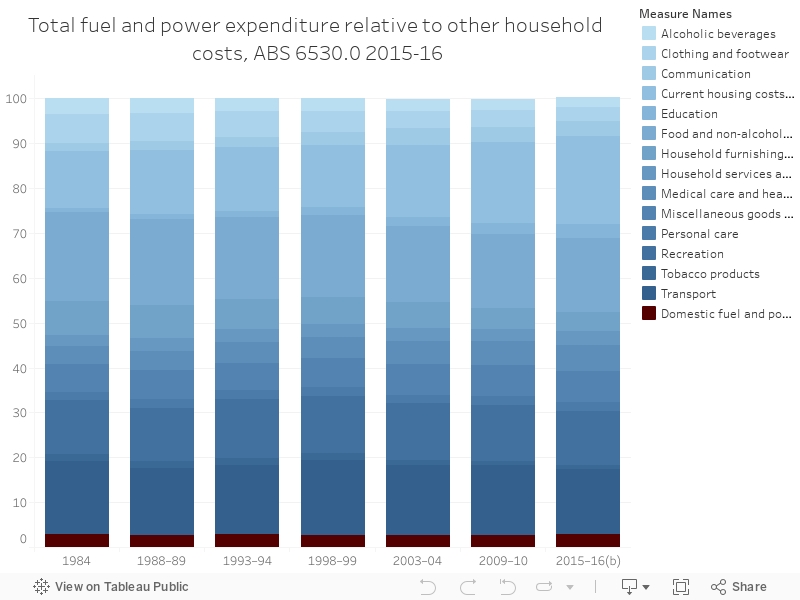
141 - Household power and fuel costs - 1984 - 2016 Proportion
The history of household spending on power and electricity in Australia, going back quite some time. Source - by proportion - which is interesting. Power and gas hasn't increased as much as I expected it would have.

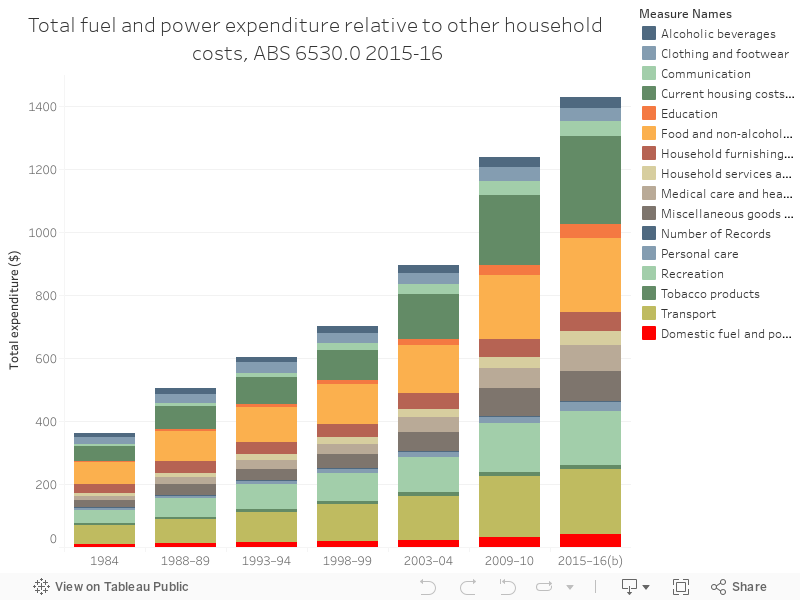
140 - Household power and fuel costs - 1984 - 2016
The history of household spending on power and electricity in Australia, going back quite some time. Source
Sunday, 13 August 2017
101 - South Australia's shifting fuel mix
This week, a series on South Australia - all using data from Global Roam's excellent NEM Review software, which you can purchase here.
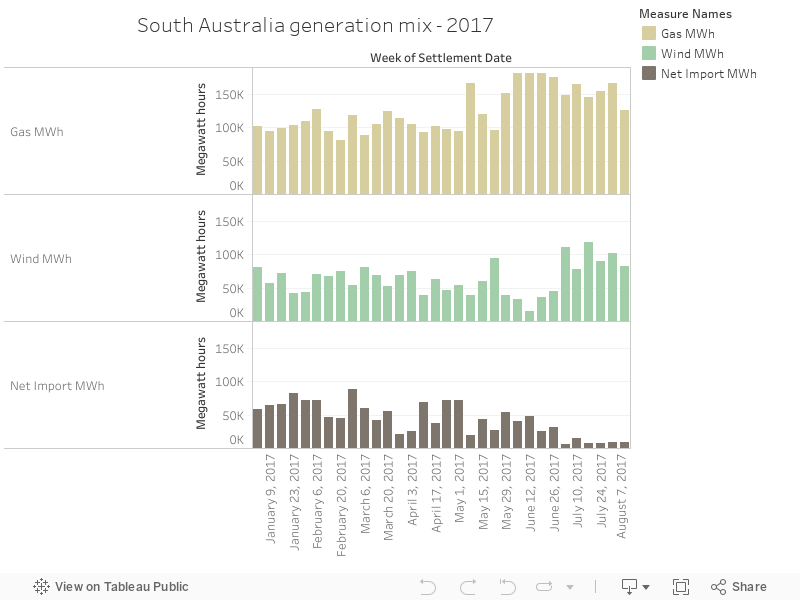
Today's chart is a simple illustration of shifts in the fuel mix so far - interestingly, after a low-wind month in June, July's high wind output means very little reliance on Victorian imports and lower exposure to high-priced gas in SA. This illustrates the advantages of wind power but it also shows the un-realised further benefits of firmed wind power - once you start dispatching low-cost resource, it'll reduce reliance on Victoria, add grid stability and also, quite importantly, reduce the amount of gas being dispatched in the state, resulting in (presumably) lower prices.
Sunday, 25 June 2017
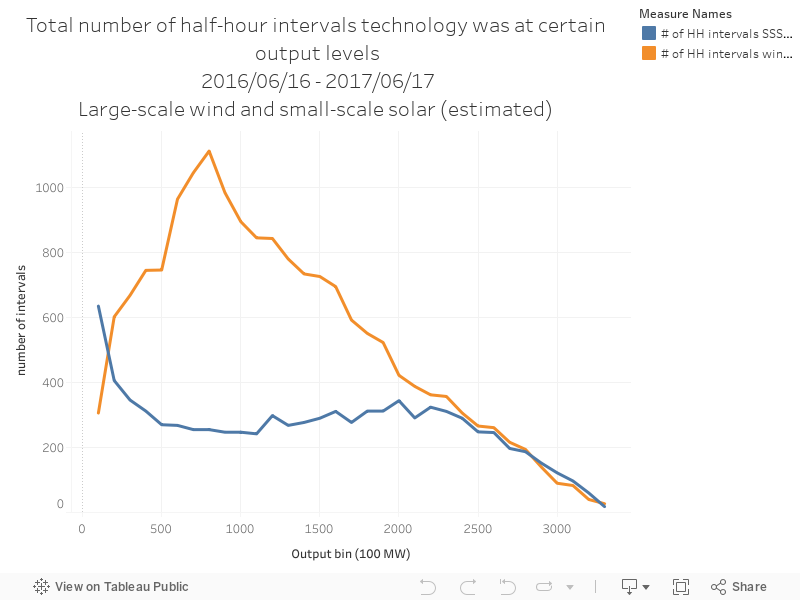
072 - Big wind vs small sun - distribution comparison
The data below come from a great, useful piece of software called NEM-Review, which shows generation data from machines on the east coast of Australia (WA's excluded)
The chart below shows the output distribution for large-scale wind farms and rooftop solar PV. The data show the total number of half hour intervals that each technology spends at different levels of output.
The chart below shows the output distribution for large-scale wind farms and rooftop solar PV. The data show the total number of half hour intervals that each technology spends at different levels of output.
071 - Large-scale PV output by day and facility
The data below come from a great, useful piece of software called NEM-Review, which shows generation data from machines on the east coast of Australia (WA's excluded)
The chart below shows the total output of large-scale solar PV output, showing average megawatt output by day.
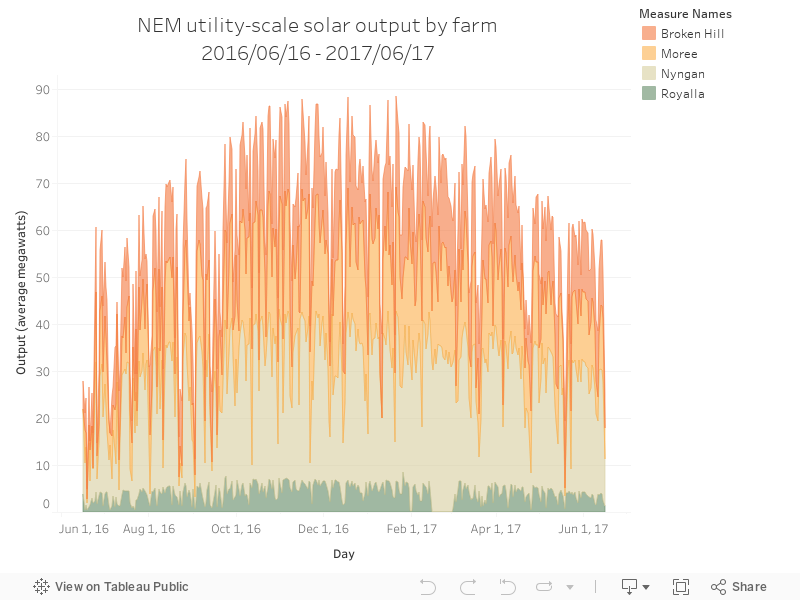
The chart below shows the total output of large-scale solar PV output, showing average megawatt output by day.
070 - Rooftop PV output by day and state
The data below come from a great, useful piece of software called NEM-Review, which shows generation data from machines on the east coast of Australia (WA's excluded)
The chart below shows estimated rooftop PV by state - the estimations of rooftop PV output come from a tool that estimates generation from a map of suburb installations.
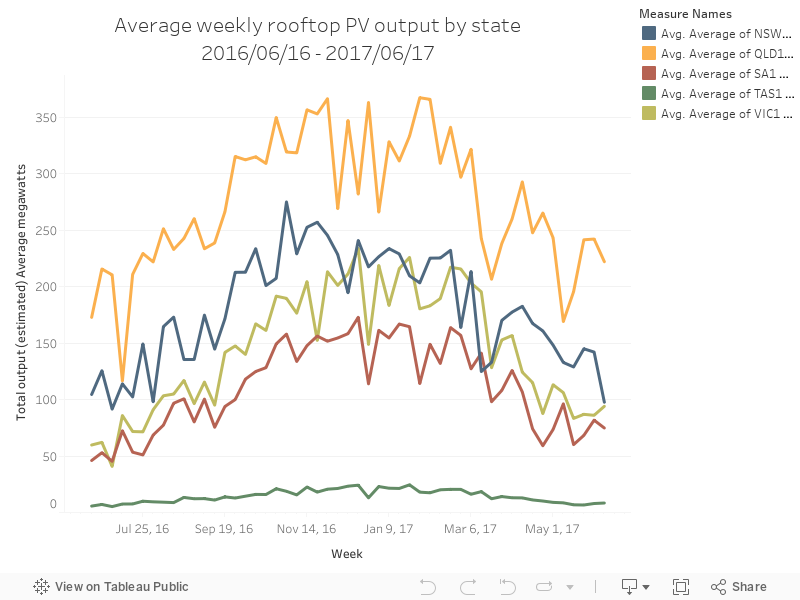
The chart below shows estimated rooftop PV by state - the estimations of rooftop PV output come from a tool that estimates generation from a map of suburb installations.
069 - Total week output by technology
The data below come from a great, useful piece of software called NEM-Review, which shows generation data from machines on the east coast of Australia (WA's excluded)
The chart below shows the total output of each fuel type by week, for those renewable energy generators on the NEM.
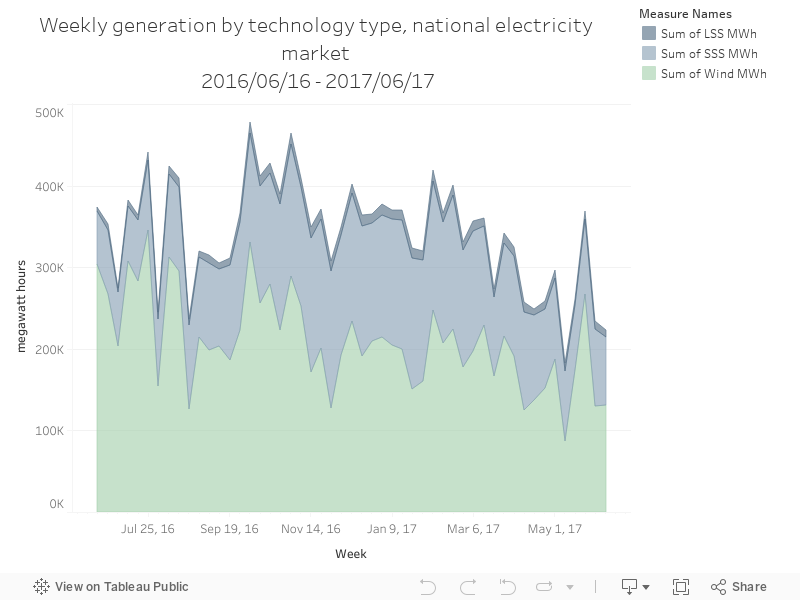
The chart below shows the total output of each fuel type by week, for those renewable energy generators on the NEM.
Tuesday, 6 June 2017
055 - French grid data - output by fuel type
The website Gridwatch makes real-time data available on UK electricity output - I recently discovered French data on there too! You can access it here. France's grid is dominated by nuclear but has a large quantity of electricity exports and imports. The data below are from 20/11/2014 16:45
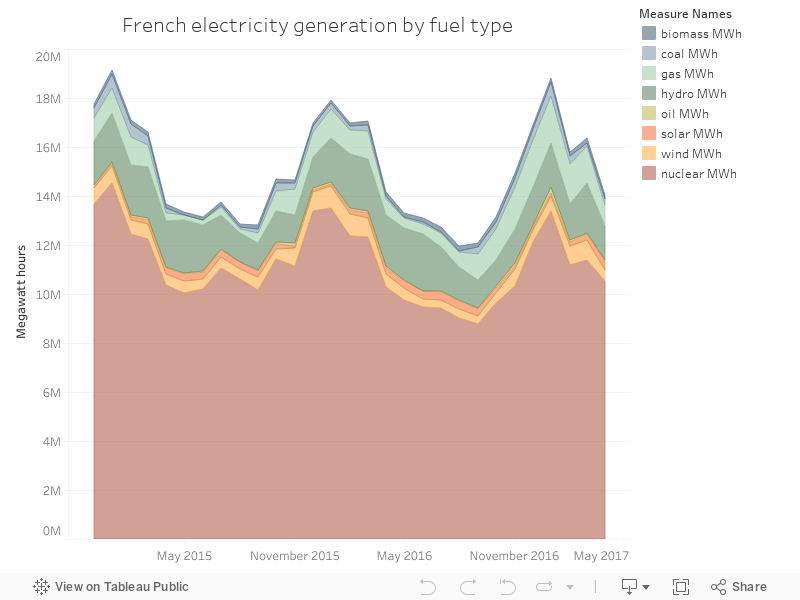
to 28/05/2017 7:45, local French time.
The chart below shows output by fuel type over the period. Enjoy!
Sunday, 4 June 2017
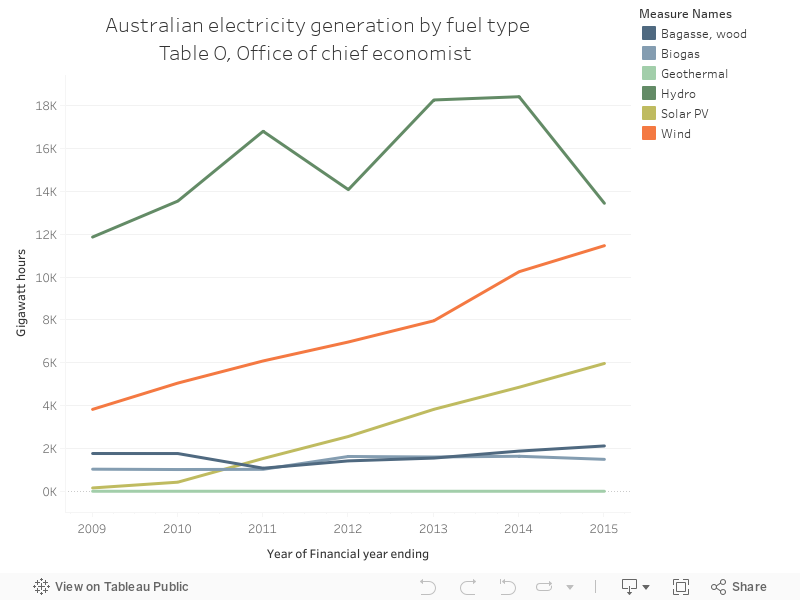
053 - Australian renewable generation - wind is catching up with hydro
The Australian Department of Industry, Innovation and Science makes a yearly energy statistics report available on their website here. It's full of interesting stuff - below is a selection showing total Australian renewable energy output.
Subscribe to:
Posts (Atom)