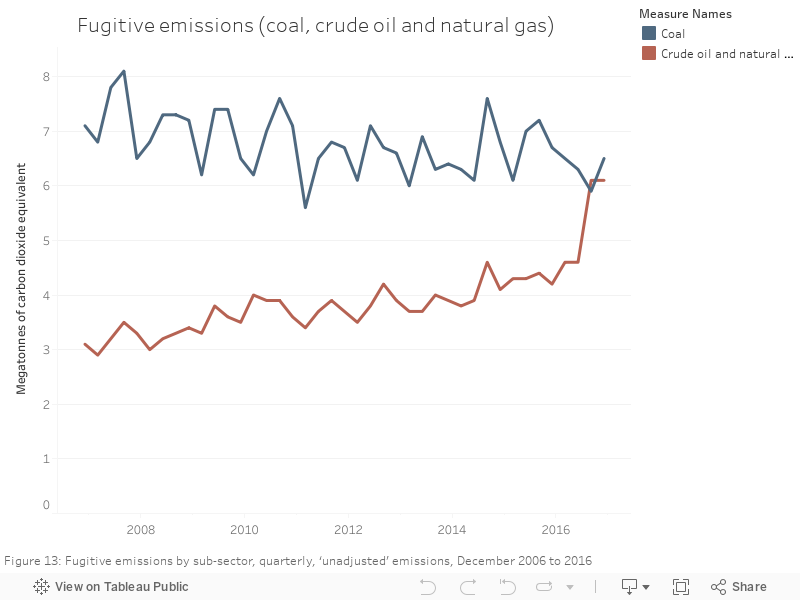
The chart below shows fugitive emissions for coal and gas
Showing posts with label Greenhouse. Show all posts
Thursday, 20 July 2017
087 - Fugitive emissions
Some recent news - the Australian Government Department of Energy recently released the 'National Greenhouse Gas Inventory' - a big, all-encompassing update of exactly how much Australia is emitting into the Earth's atmosphere through the operation of our economy. There'a whole stack of data in the December 2016 update.
The chart below shows fugitive emissions for coal and gas
Tuesday, 18 July 2017
084 - Change in emissions, by sector
Some recent news - the Australian Government Department of Energy recently released the 'National Greenhouse Gas Inventory' - a big, all-encompassing update of exactly how much Australia is emitting into the Earth's atmosphere through the operation of our economy. There'a whole stack of data in the December 2016 update.
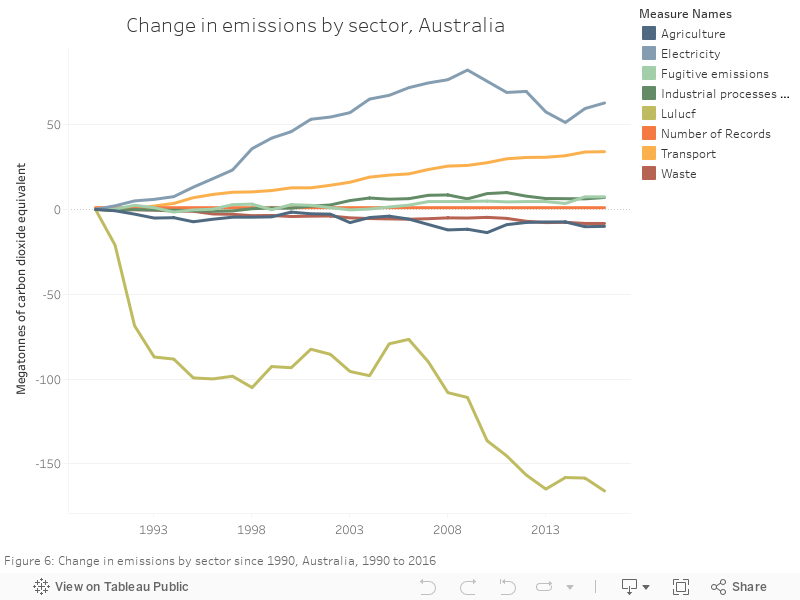
The chart below shows total change in emissions, by sector. Most interesting is electricity, which saw a period of decrease but has, in the past few years, started climbing back up again.
Monday, 17 July 2017
083 - Emissions by sector
Some recent news - the Australian Government Department of Energy recently released the 'National Greenhouse Gas Inventory' - a big, all-encompassing update of exactly how much Australia is emitting into the Earth's atmosphere through the operation of our economy. There'a whole stack of data in the December 2016 update.
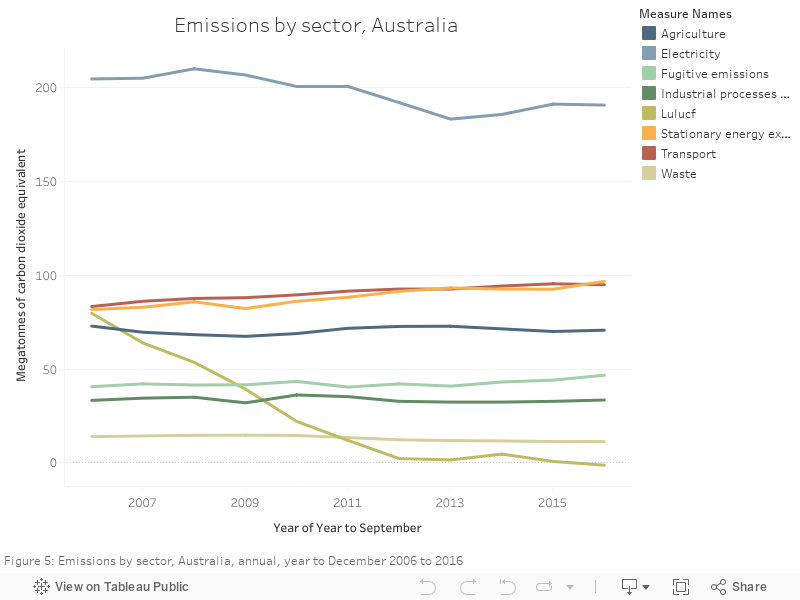
The chart below shows total emissions by sector, with a clear decrease in land use, and electricity still dominating all the sectors in totals.
Sunday, 16 July 2017
082 - Australia's increasing emissions
Some recent news - the Australian Government Department of Energy recently released the 'National Greenhouse Gas Inventory' - a big, all-encompassing update of exactly how much Australia is emitting into the Earth's atmosphere through the operation of our economy. There'a whole stack of data in the December 2016 update.
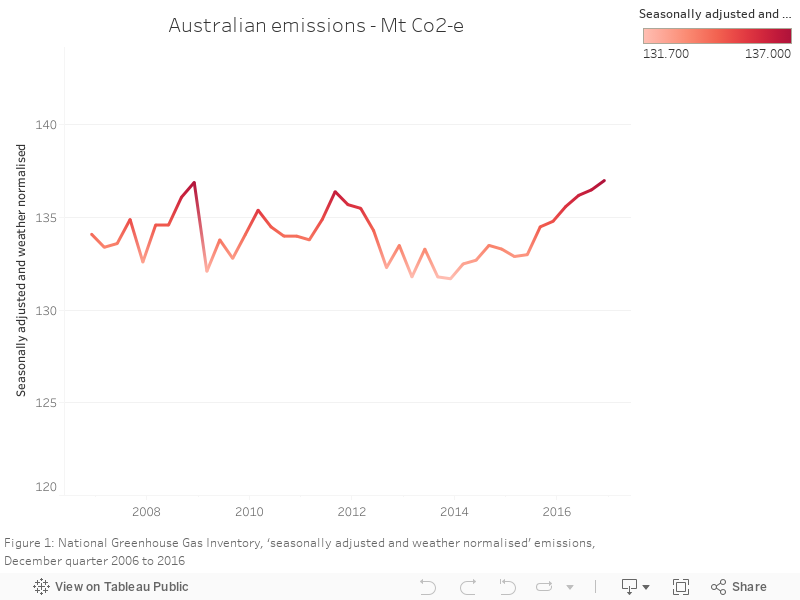
The chart below shows the total emissions from 2006 to 2016 - the latest figure, for Dec 2016, is the highest in the data set made available in the file.
Subscribe to:
Posts (Atom)