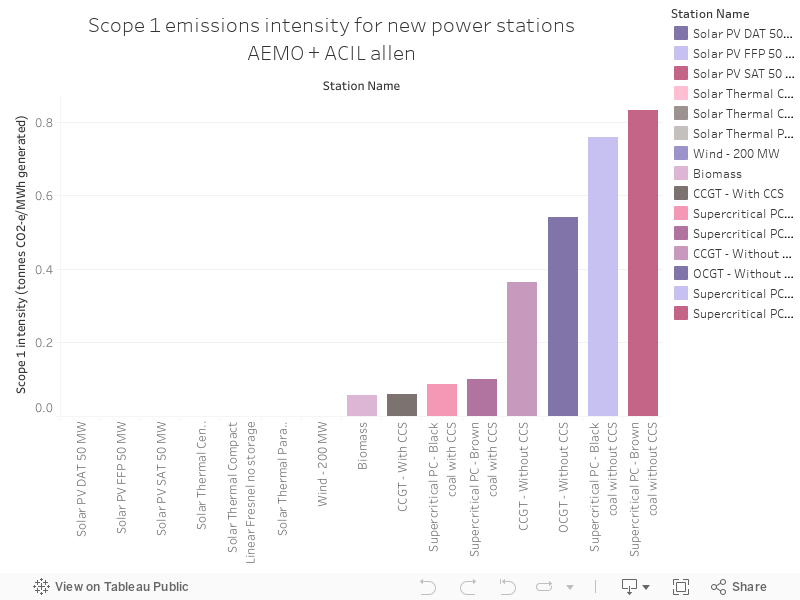
The chart below shows emissions intensity for new power stations - measured in the tonnes of greenhouse gases emitted for every megawatt hour of generation.
Showing posts with label Scope1. Show all posts
Thursday, 15 June 2017
061 - Emissions intensity of new NEM generators
The Australian Electricity Market Operator has a database called the National Transmission Network Development Plan (NTNDP) database - the NTNDP is basically a report that looks at what future grid wires might look like. There are some detailed, fascinating data points underneath this report.
The chart below shows emissions intensity for new power stations - measured in the tonnes of greenhouse gases emitted for every megawatt hour of generation.
Tuesday, 13 June 2017
059 - Scope 1 emissions intensity for
The Australian Electricity Market Operator has a database called the National Transmission Network Development Plan (NTNDP) database - the NTNDP is basically a report that looks at what future grid wires might look like. There are some detailed, fascinating data points underneath this report.
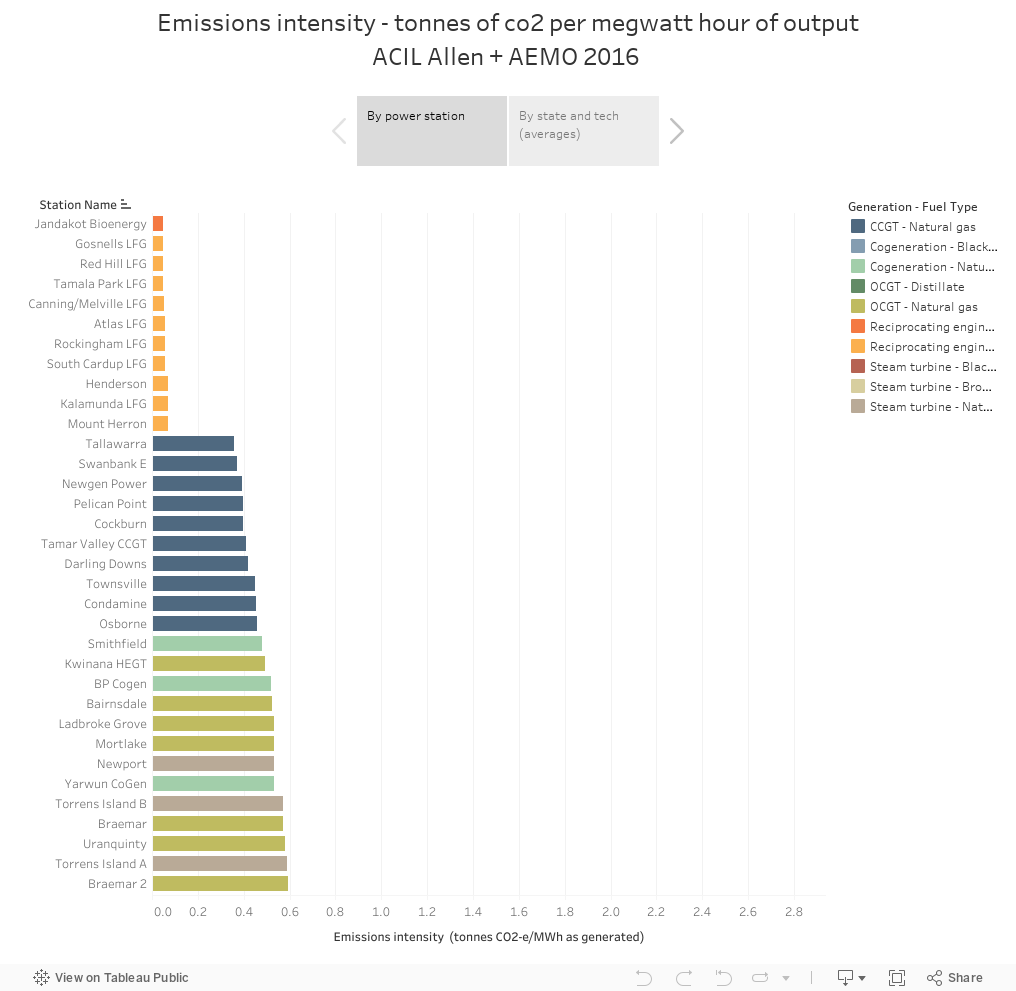
The chart below shows emissions intensity - the numbers of tonnes of greenhouse gases that are emitted for every megawatt hour of generation from power stations - by state, and by individual power plants.
Subscribe to:
Posts (Atom)