Showing posts with label Solar. Show all posts

Thursday, 20 July 2017

100 - New large-scale solar plants 2016

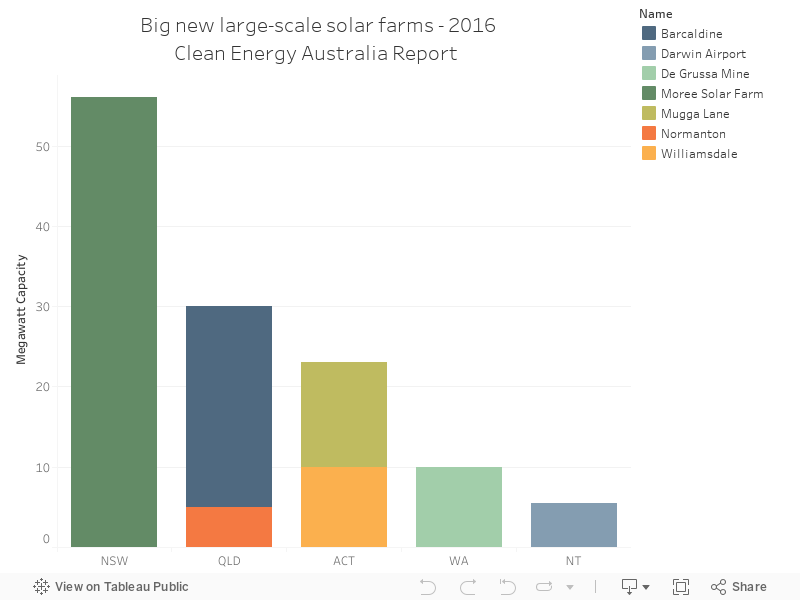
The Clean Energy Council's 2016 renewable energy report is a great summary of some vital statistics on Australian renewable energy from a variety of states.

The chart below shows a stack of new large scale solar farms in Australia 


Monday, 10 July 2017

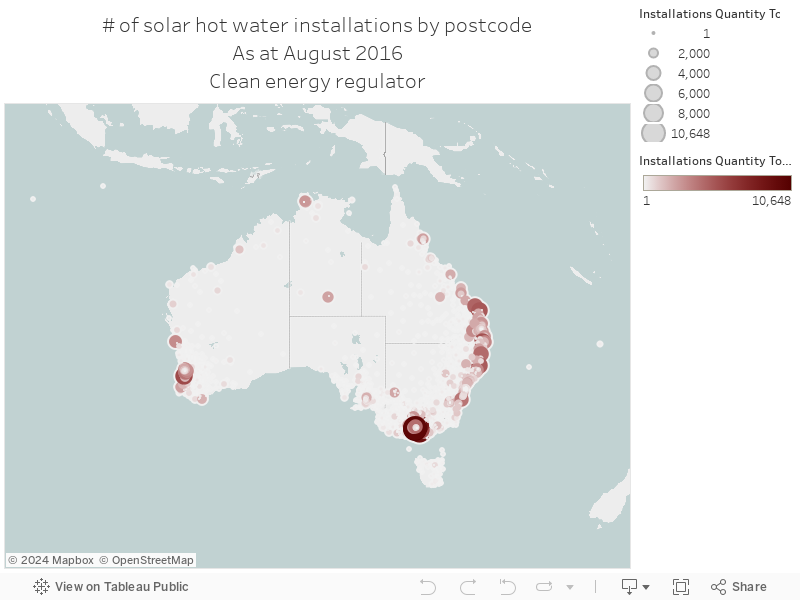
078 - Solar hot water installations map

Also from the Clean Energy Regulator - a map of the total number of installations of solar hot water systems, as part of the small scale renewable energy scheme, by postcode. Enjoy!


Sunday, 25 June 2017

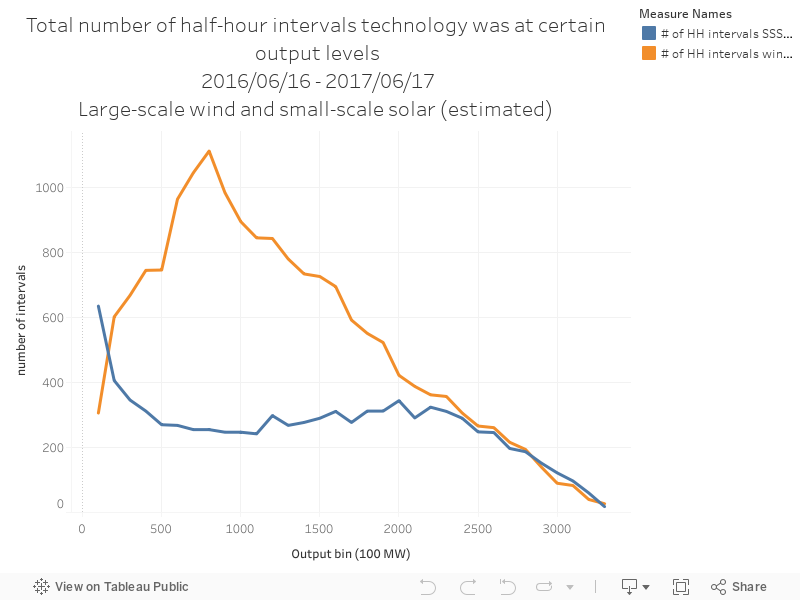
072 - Big wind vs small sun - distribution comparison

The data below come from a great, useful piece of software called NEM-Review, which shows generation data from machines on the east coast of Australia (WA's excluded)

The chart below shows the output distribution for large-scale wind farms and rooftop solar PV. The data show the total number of half hour intervals that each technology spends at different levels of output.


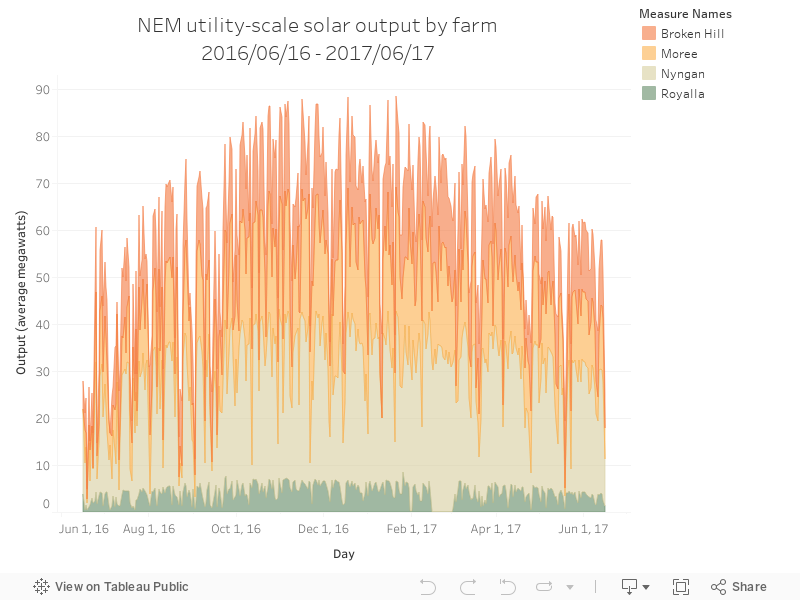
071 - Large-scale PV output by day and facility

The data below come from a great, useful piece of software called NEM-Review, which shows generation data from machines on the east coast of Australia (WA's excluded)

The chart below shows the total output of large-scale solar PV output, showing average megawatt output by day.


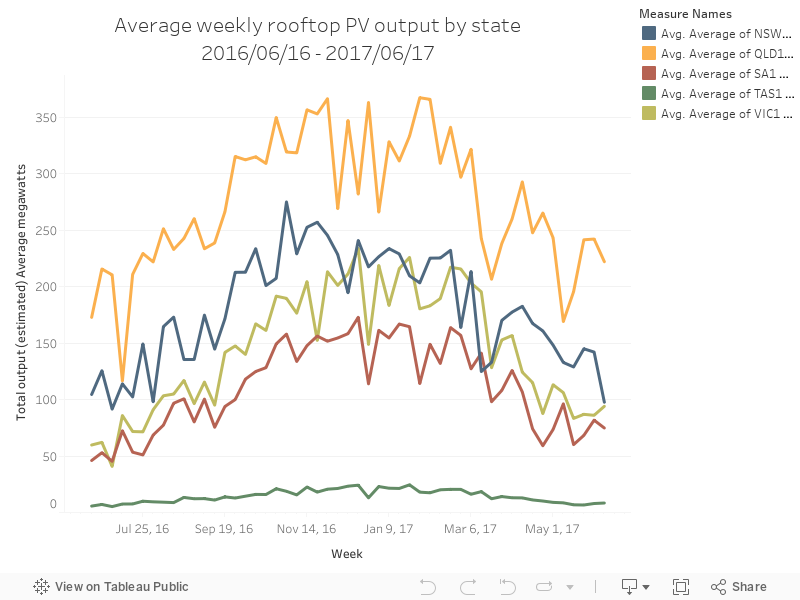
070 - Rooftop PV output by day and state

The data below come from a great, useful piece of software called NEM-Review, which shows generation data from machines on the east coast of Australia (WA's excluded)

The chart below shows estimated rooftop PV by state - the estimations of rooftop PV output come from a tool that estimates generation from a map of suburb installations.


Tuesday, 30 May 2017

050 - Australian rooftop solar installation data - Monthly

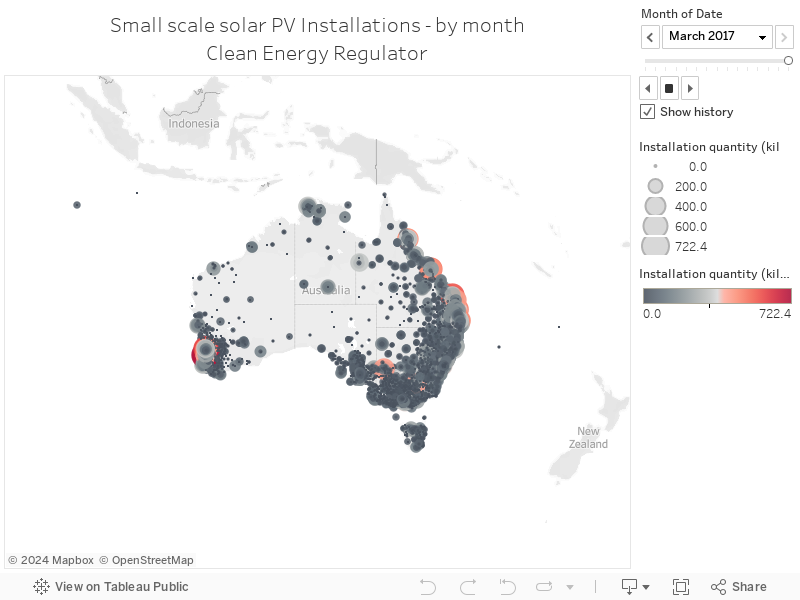
The Clean Energy Regulator makes detailed postcode-level data on solar PV installations publicly available, and it's updated regularly. The map below shows total installations per month - you can use the month card on the right hand side to navigate:


Monday, 29 May 2017

049 - Australian rooftop solar installation data - 2016

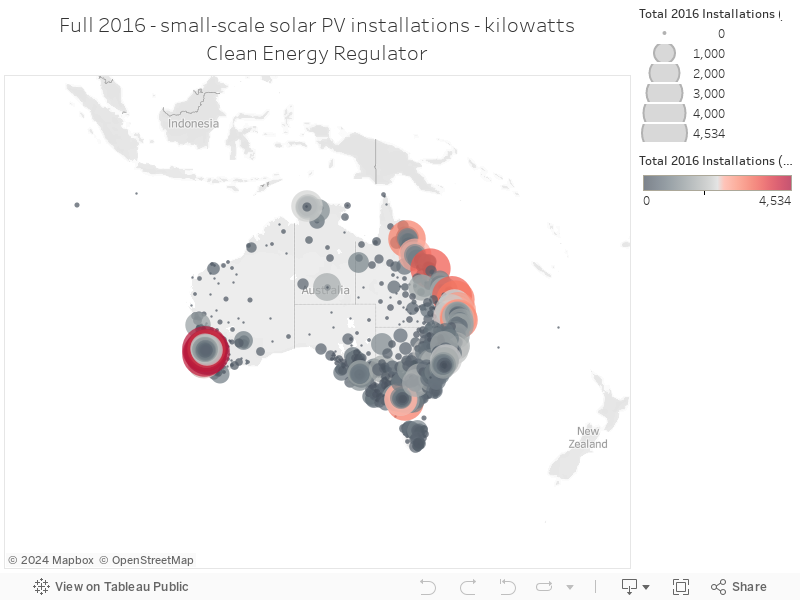
The Clean Energy Regulator makes detailed postcode-level data on solar PV installations publicly available, and it's updated regularly. The map below shows total installations for the full year of 2016 in total kilowatts:


Sunday, 28 May 2017

048 - Australian rooftop solar installation data - March 2017

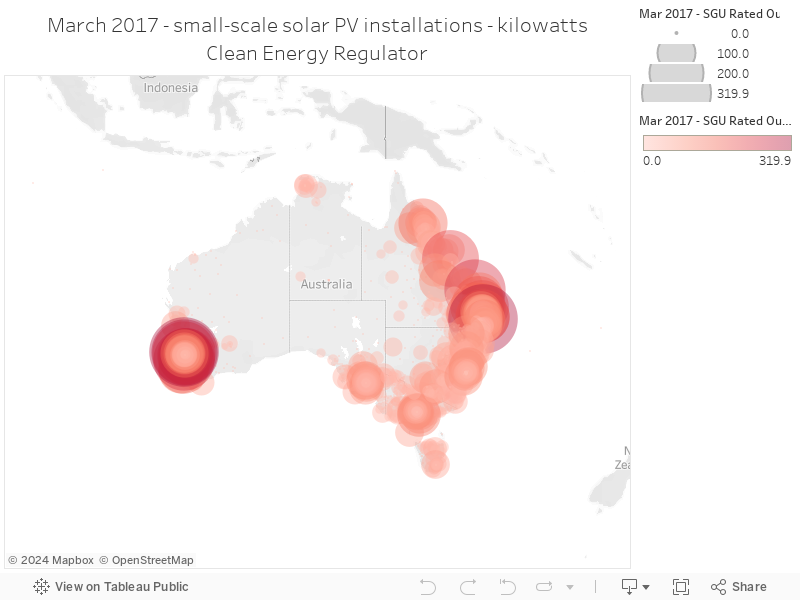
The Clean Energy Regulator makes detailed postcode-level data on solar PV installations publicly available, and it's updated regularly. The map below shows total installations for the month of March 2017:


Tuesday, 23 May 2017

045 - Potential emissions reductions from Sydney solar

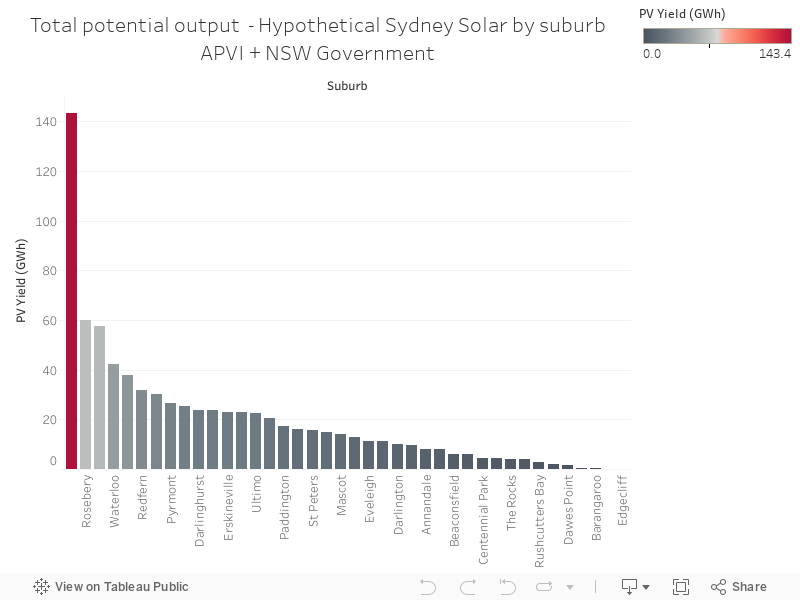
A fascinating study from the Australian Solar PV Institute and UNSW, supported by the NSW government, shows the potential for solar PV in Sydney's inner city suburbs, looking at all rooftops alongside a few interesting case studies.

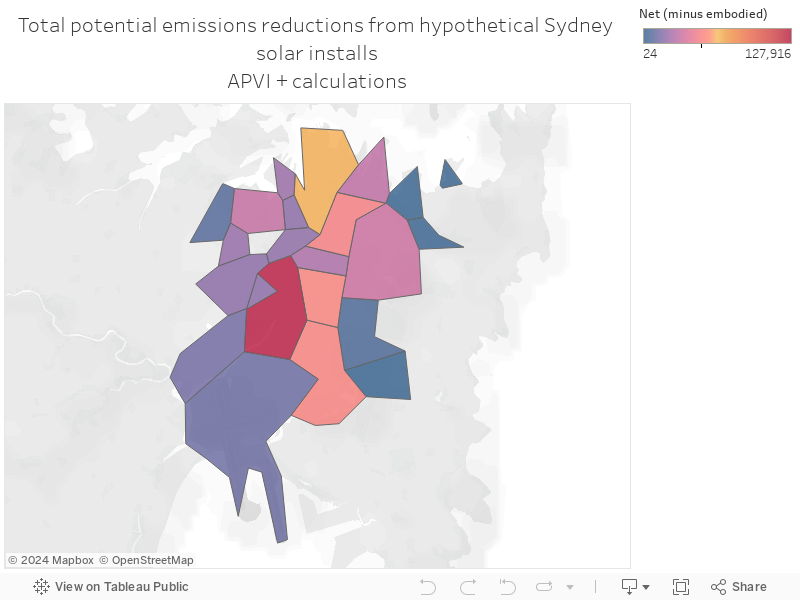
The graphic below shows a calculation I've done of potential emissions reductions from usage of the technology across Sydney's suburbs, shown as a map - I've subtracted the emissions used in the manufacture of the panels as the researchers have done in the paper. 


044 - Sydney CBD's huge solar output potential

A fascinating study from the Australian Solar PV Institute and UNSW, supported by the NSW government, shows the potential for solar PV in Sydney's inner city suburbs, looking at all rooftops alongside a few interesting case studies.

The chart below shows total potential generation across the suburbs

Wednesday, 10 May 2017

036 - Changes in installation size over the Solar Bonus Scheme

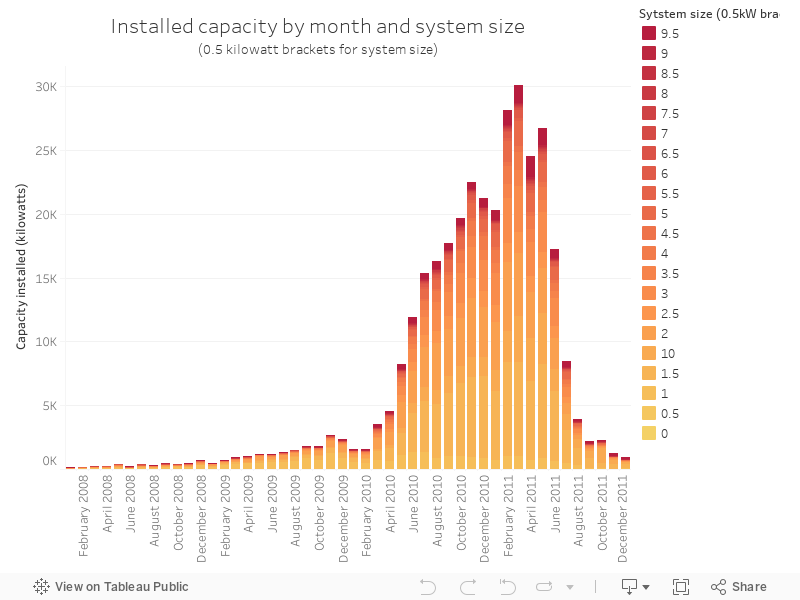
The NSW solar bonus scheme was launched in January 2010, "to encourage the uptake of renewable energy, handed homeowners 60¢ or 20¢ "feed-in" tariffs per kilowatt hour, for the solar energy they put back into the grid".

The NSW government makes data available on their website detailing installations - the chart below shows the amount of capacity installed each month, broken up by the size of the installation. Bigger installations are darker red; smaller ones are lighter.

Source.

Tuesday, 9 May 2017

035 - The rapid uptick in solar installations under NSW's solar bonus scheme

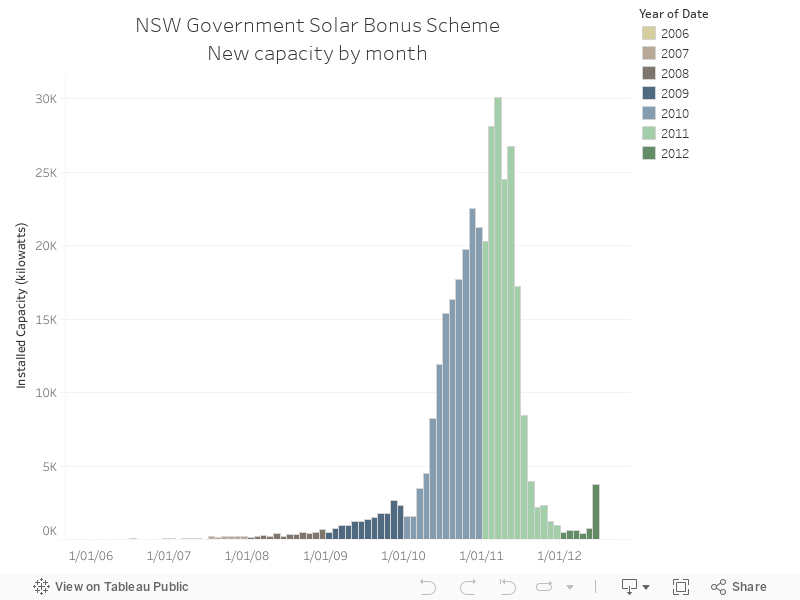
The NSW solar bonus scheme was launched in January 2010, "to encourage the uptake of renewable energy, handed homeowners 60¢ or 20¢ "feed-in" tariffs per kilowatt hour, for the solar energy they put back into the grid".

The NSW government makes data available on their website detailing installations - the chart below shows the total capacity installed for each month in the data set.

Source.