This series is a big, huge, wonderful batch of Opal card data from two very limited time periods and completely anonymised using a range of techniques, from the NSW Open Data portal. You have to sign up to NSW Open Data to get copies, but it's worth it, it's quite interesting.
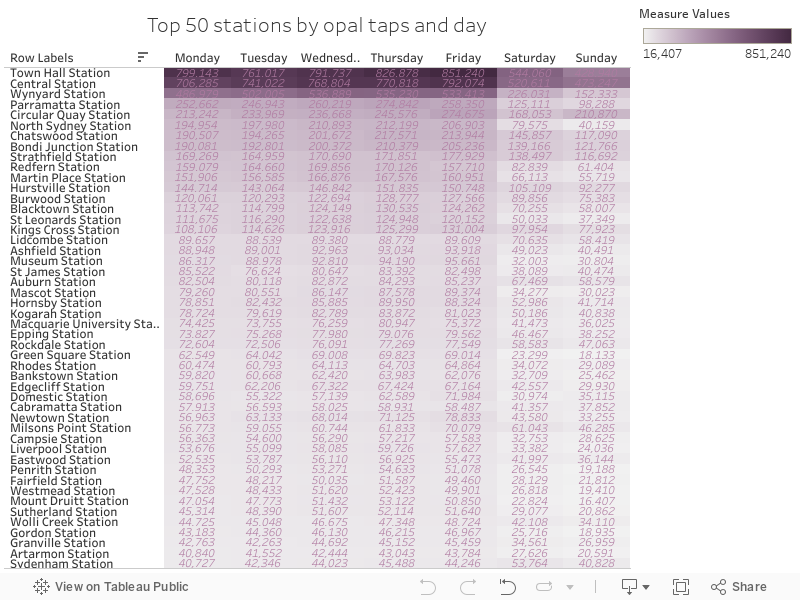
The chart below shows the top 50 stations by total taps for the full time period, by weekday
Showing posts with label Taps. Show all posts
Monday, 23 October 2017
153 - Opal trips by postcode
This series is a big, huge, wonderful batch of Opal card data from two very limited time periods and completely anonymised using a range of techniques, from the NSW Open Data portal. You have to sign up to NSW Open Data to get copies, but it's worth it, it's quite interesting.
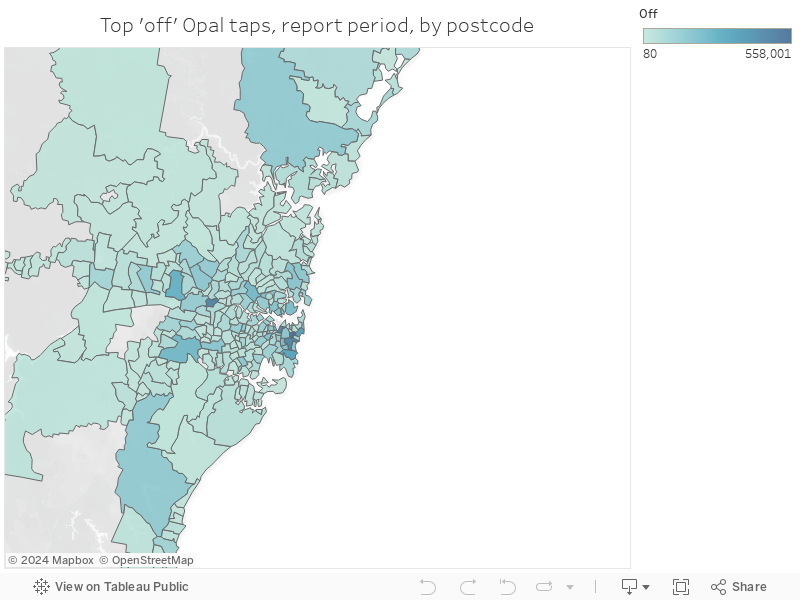
The chart below shows total trips by postcode, excluding 2000 (because it was huge)
152 - Opal tips by mode, day and hour
This series is a big, huge, wonderful batch of Opal card data from two very limited time periods and completely anonymised using a range of techniques, from the NSW Open Data portal. You have to sign up to NSW Open Data to get copies, but it's worth it, it's quite interesting.
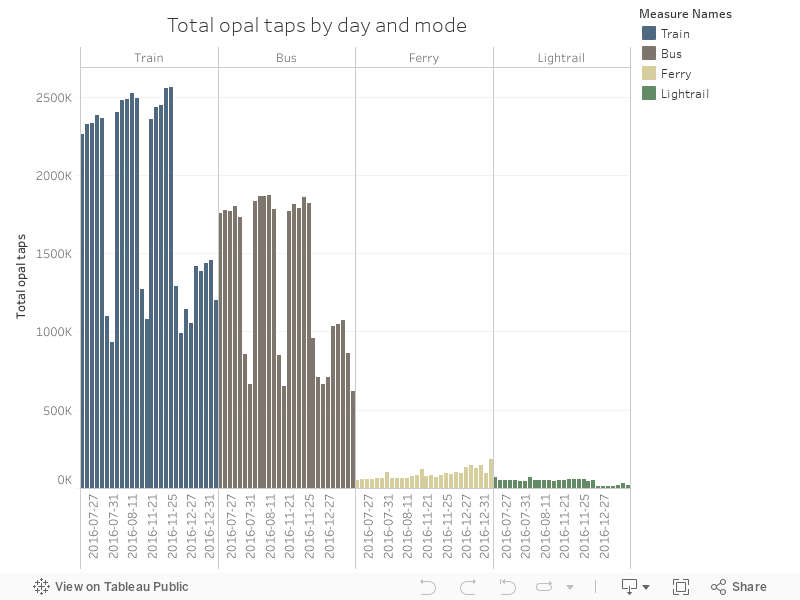
The chart below shows total taps made by mode of transport and day, for all of the days available in the total data set
151 - Opal ferry data by time and day
This series is a big, huge, wonderful batch of Opal card data from two very limited time periods and completely anonymised using a range of techniques, from the NSW Open Data portal. You have to sign up to NSW Open Data to get copies, but it's worth it, it's quite interesting.
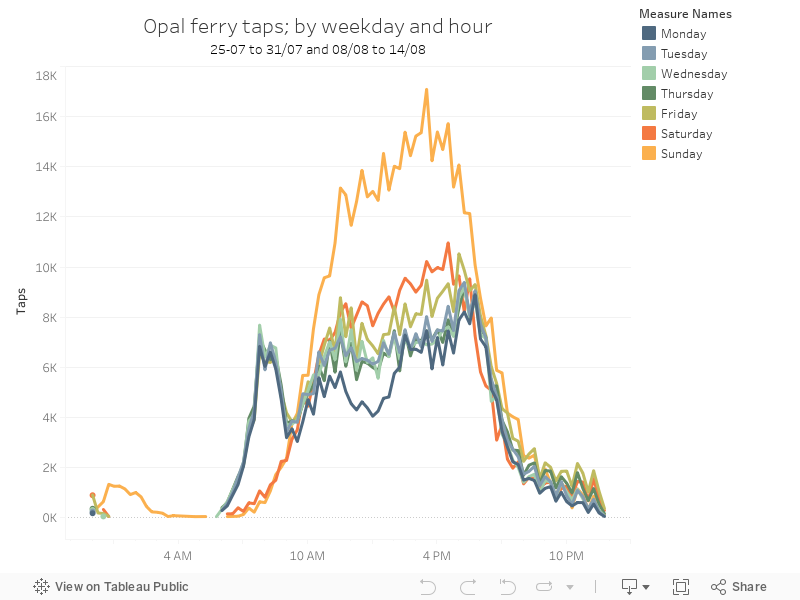
This chart shows total taps by day and hour, for NSW' ferries
150 - Opal train data by time and day
This series is a big, huge, wonderful batch of Opal card data from two very limited time periods and completely anonymised using a range of techniques, from the NSW Open Data portal. You have to sign up to NSW Open Data to get copies, but it's worth it, it's quite interesting.
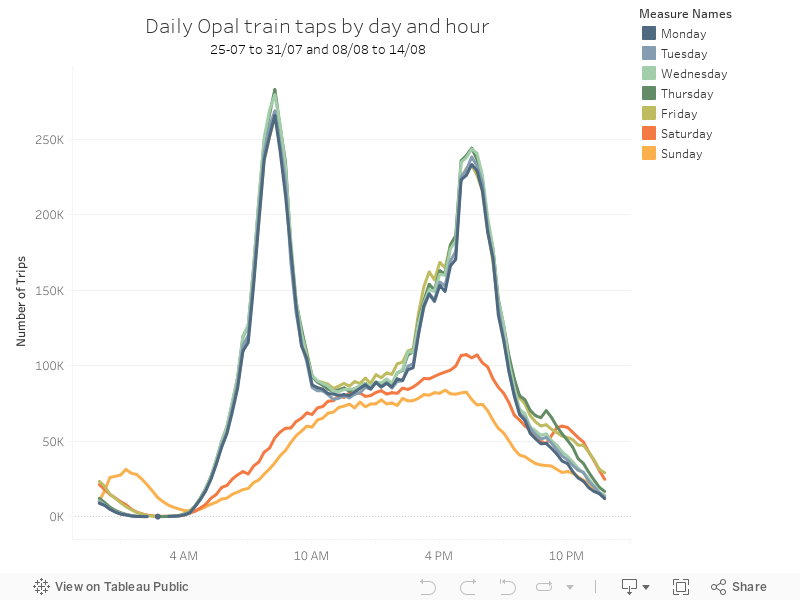
This chart shows total train-specific taps by day, and by hour
149 - Tap on vs tap off - Opal Train data
This series is a big, huge, wonderful batch of Opal card data from two very limited time periods and completely anonymised using a range of techniques, from the NSW Open Data portal. You have to sign up to NSW Open Data to get copies, but it's worth it, it's quite interesting.
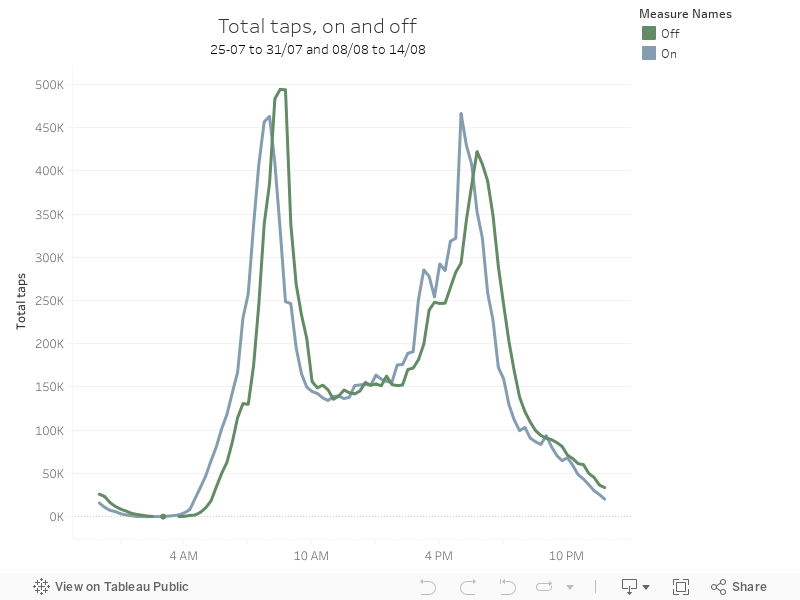
The data below show taps on vs taps off, showing the start and end of journeys by hour, only for trains
148 - Opal Data Daily - Batch 2 - Holiday/NYE
This series is a big, huge, wonderful batch of Opal card data from two very limited time periods and completely anonymised using a range of techniques, from the NSW Open Data portal. You have to sign up to NSW Open Data to get copies, but it's worth it, it's quite interesting.
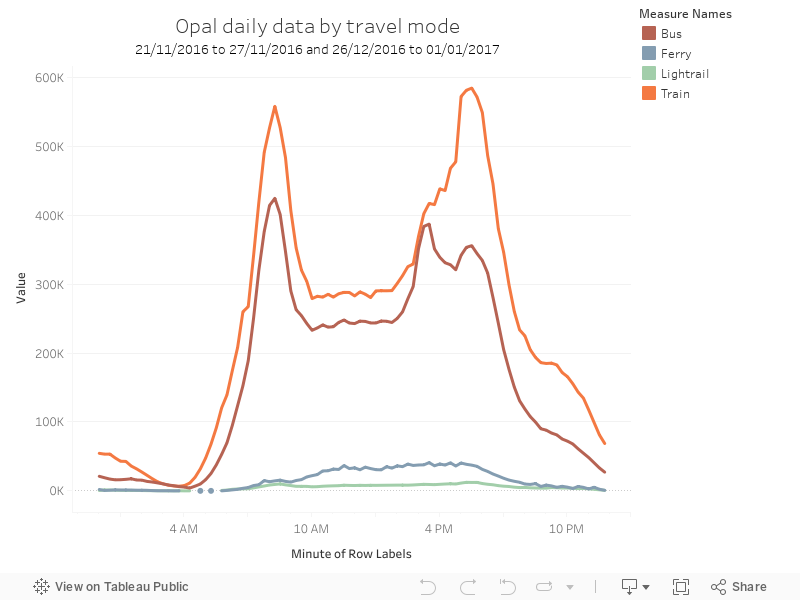
This second period is 21/11/2016 to 27/11/2016 and 26/12/2016 to 01/01/2017, showing total taps in a holiday period
147 - Opal data Daily - Batch 1 - Normal
This series is a big, huge, wonderful batch of Opal card data from two very limited time periods and completely anonymised using a range of techniques, from the NSW Open Data portal. You have to sign up to NSW Open Data to get copies, but it's worth it, it's quite interesting.
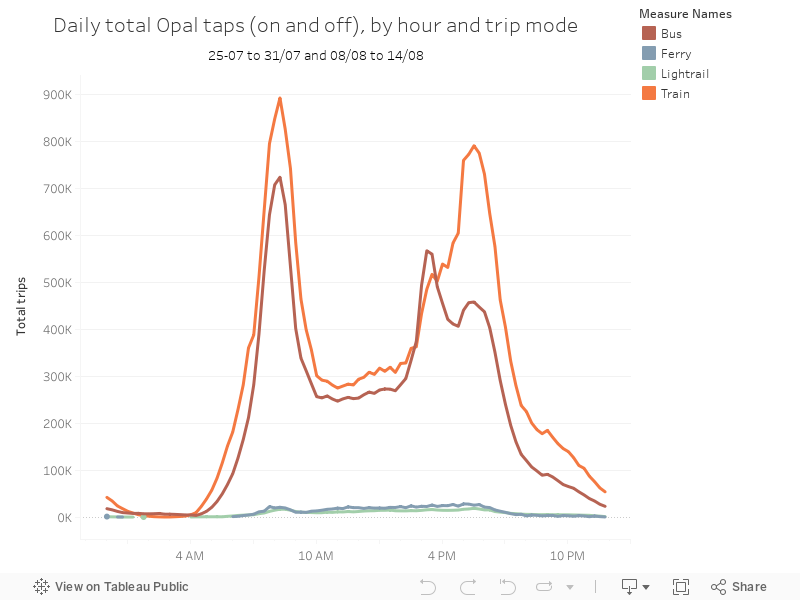
Time period one is 25-07 to 31/07 and 08/08 to 14/08, and the chart below shows total taps by hour of day and mode of transport.
Subscribe to:
Posts (Atom)