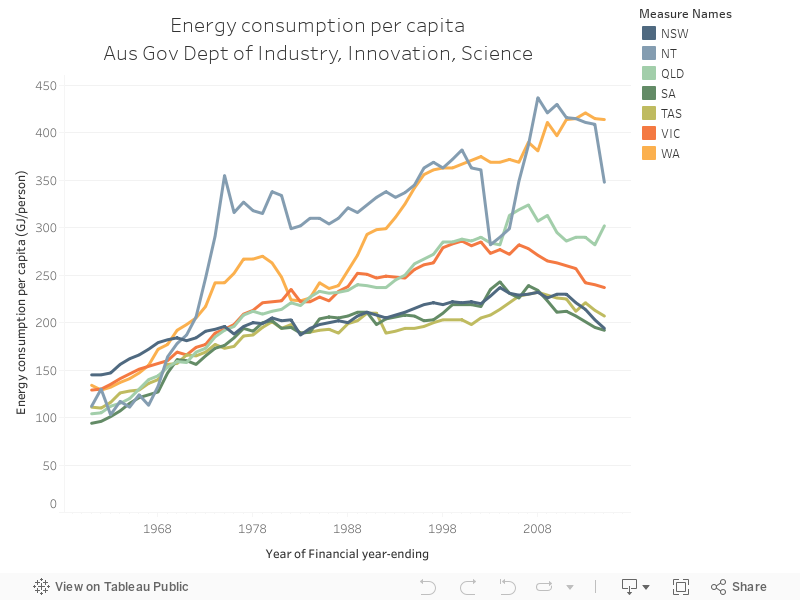
The chart below shows changes in electricity generation in the national electricity market. Though coal is going up, variable renewables and hydro are catching up with gas and coal. Compare 2012 to 2016 - that's a fair bit of change for four years, though there's still a long way to go.
Showing posts with label Industry_Gov. Show all posts
Thursday, 20 July 2017
086 - NEM generation by fuel type
Some recent news - the Australian Government Department of Energy recently released the 'National Greenhouse Gas Inventory' - a big, all-encompassing update of exactly how much Australia is emitting into the Earth's atmosphere through the operation of our economy. There'a whole stack of data in the December 2016 update.
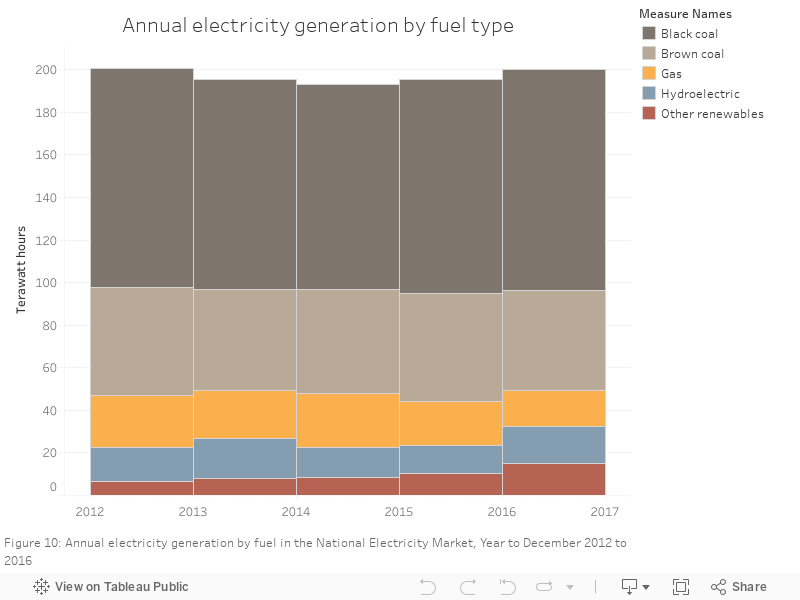
The chart below shows changes in electricity generation in the national electricity market. Though coal is going up, variable renewables and hydro are catching up with gas and coal. Compare 2012 to 2016 - that's a fair bit of change for four years, though there's still a long way to go.
087 - Fugitive emissions
Some recent news - the Australian Government Department of Energy recently released the 'National Greenhouse Gas Inventory' - a big, all-encompassing update of exactly how much Australia is emitting into the Earth's atmosphere through the operation of our economy. There'a whole stack of data in the December 2016 update.
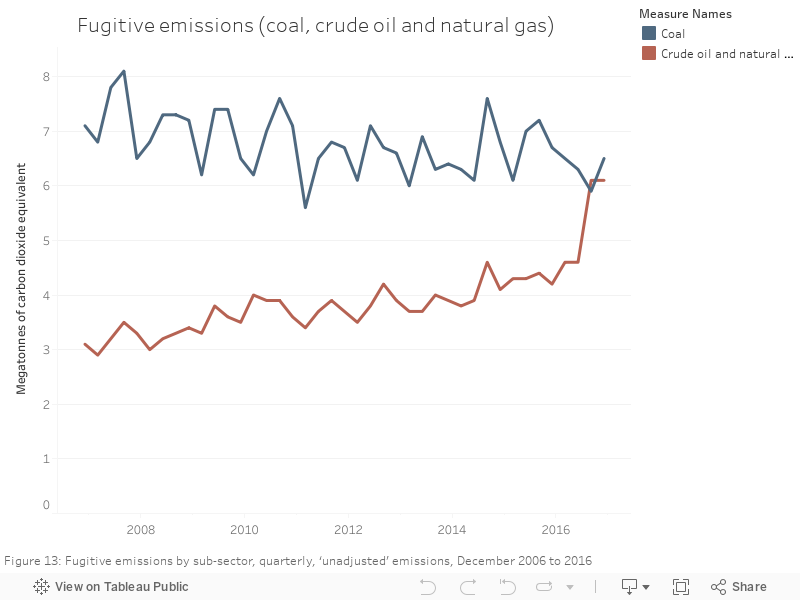
The chart below shows fugitive emissions for coal and gas
089 - NEM generation vs elec emissions
Some recent news - the Australian Government Department of Energy recently released the 'National Greenhouse Gas Inventory' - a big, all-encompassing update of exactly how much Australia is emitting into the Earth's atmosphere through the operation of our economy. There'a whole stack of data in the December 2016 update.
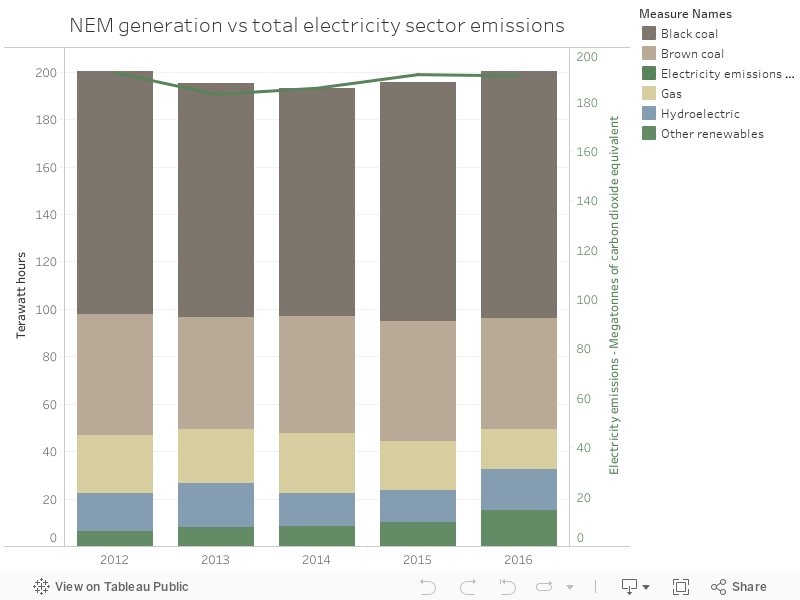
The chart below shows the generation mix vs the total emissions for electricity - which have increased as coal's share has increased, over the past few years.
088 - Non-hydro renewables are the only growing NEM tech
Some recent news - the Australian Government Department of Energy recently released the 'National Greenhouse Gas Inventory' - a big, all-encompassing update of exactly how much Australia is emitting into the Earth's atmosphere through the operation of our economy. There'a whole stack of data in the December 2016 update.
The chart below shows calculated change in output from the previous year, in total terawatt hours, for the NEM, by technology.
Wednesday, 19 July 2017
085 - NEM demand history
Some recent news - the Australian Government Department of Energy recently released the 'National Greenhouse Gas Inventory' - a big, all-encompassing update of exactly how much Australia is emitting into the Earth's atmosphere through the operation of our economy. There'a whole stack of data in the December 2016 update.
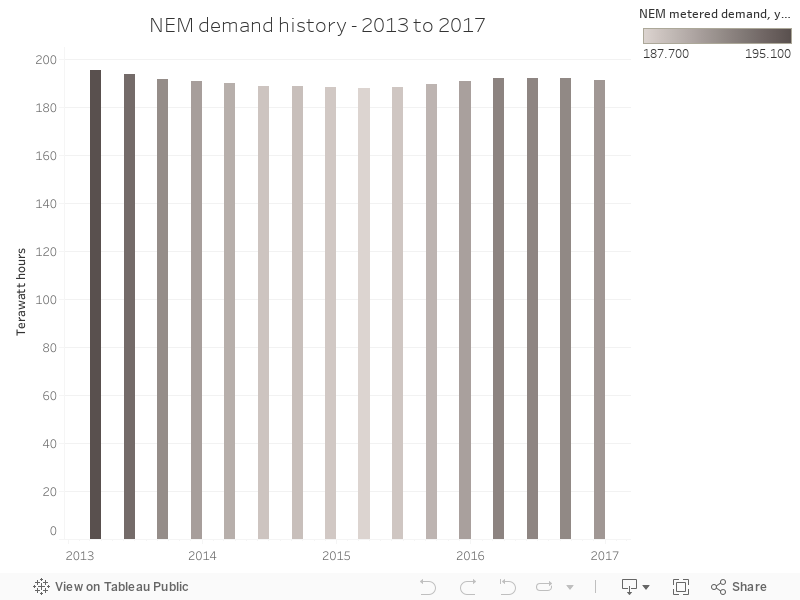
This chart answers the question - is demand going up or down? Of course, the answer is 'sort of both' - it's been relatively steady since 2015.
Tuesday, 18 July 2017
084 - Change in emissions, by sector
Some recent news - the Australian Government Department of Energy recently released the 'National Greenhouse Gas Inventory' - a big, all-encompassing update of exactly how much Australia is emitting into the Earth's atmosphere through the operation of our economy. There'a whole stack of data in the December 2016 update.
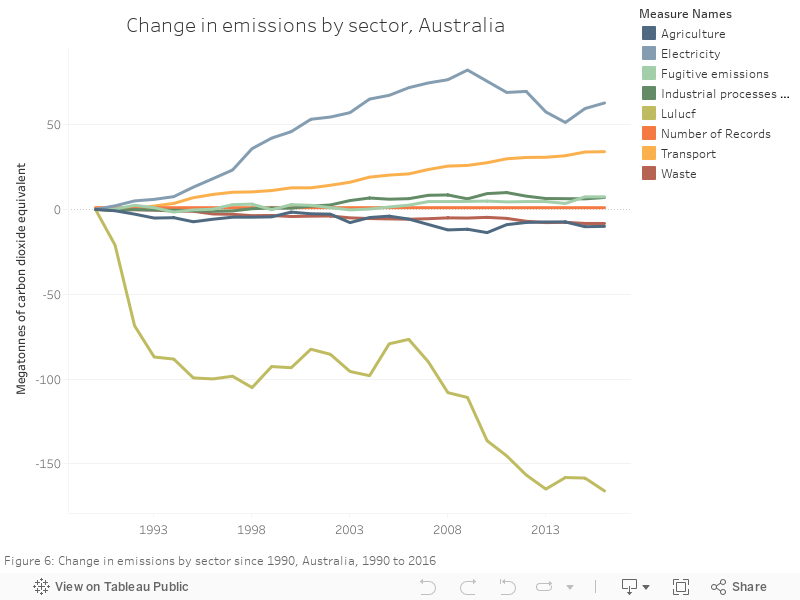
The chart below shows total change in emissions, by sector. Most interesting is electricity, which saw a period of decrease but has, in the past few years, started climbing back up again.
Monday, 17 July 2017
083 - Emissions by sector
Some recent news - the Australian Government Department of Energy recently released the 'National Greenhouse Gas Inventory' - a big, all-encompassing update of exactly how much Australia is emitting into the Earth's atmosphere through the operation of our economy. There'a whole stack of data in the December 2016 update.
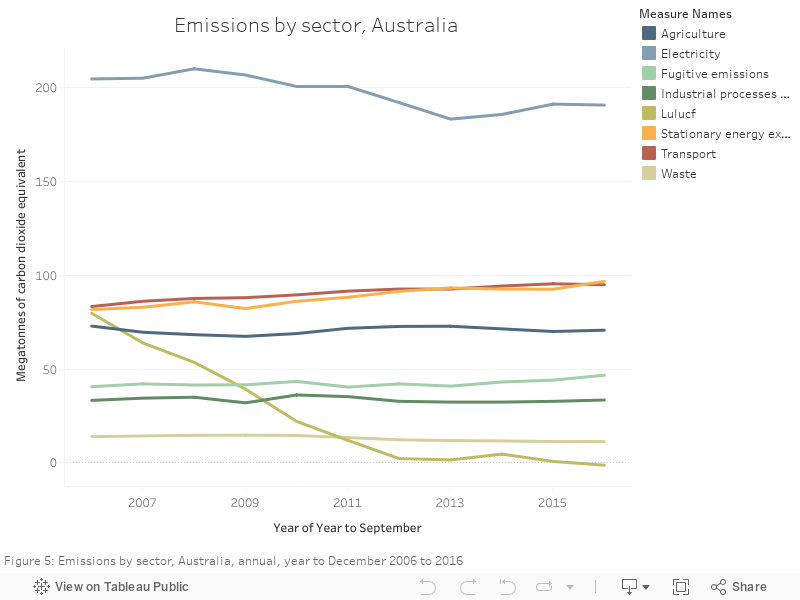
The chart below shows total emissions by sector, with a clear decrease in land use, and electricity still dominating all the sectors in totals.
Sunday, 16 July 2017
082 - Australia's increasing emissions
Some recent news - the Australian Government Department of Energy recently released the 'National Greenhouse Gas Inventory' - a big, all-encompassing update of exactly how much Australia is emitting into the Earth's atmosphere through the operation of our economy. There'a whole stack of data in the December 2016 update.
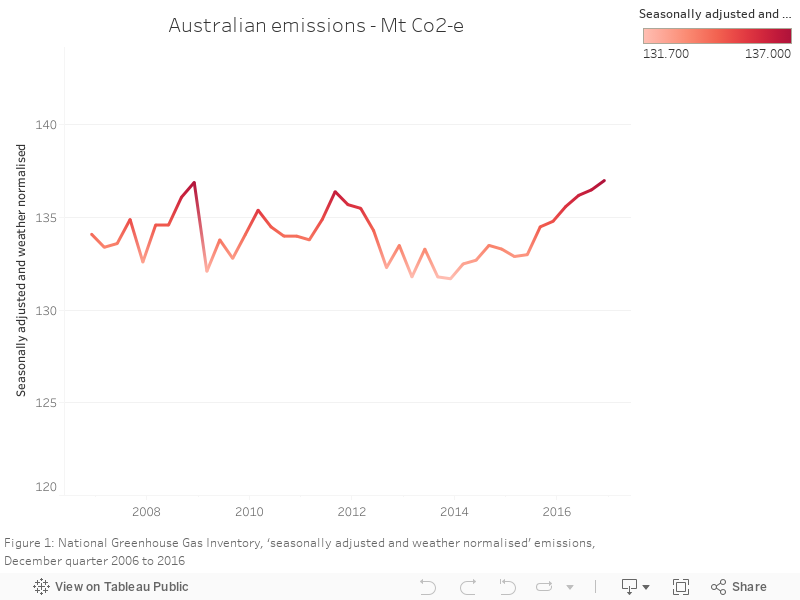
The chart below shows the total emissions from 2006 to 2016 - the latest figure, for Dec 2016, is the highest in the data set made available in the file.
Monday, 5 June 2017
054 - Coal production by state
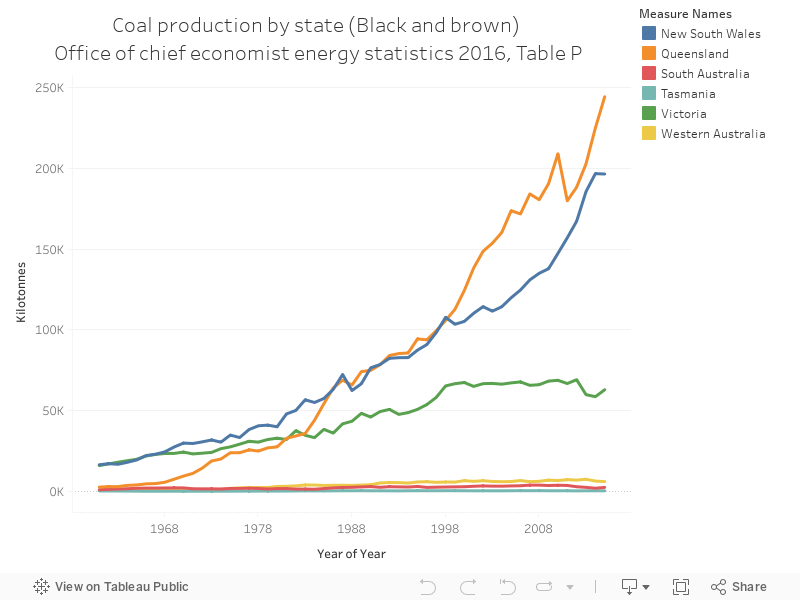
The Australian Department of Industry, Innovation and Science makes a yearly energy statistics report available on their website here. It's full of interesting stuff - below is a selection showing total coal production by state (black and brown). Check the website for some caveats on coal definitions by state.
Sunday, 4 June 2017
053 - Australian renewable generation - wind is catching up with hydro
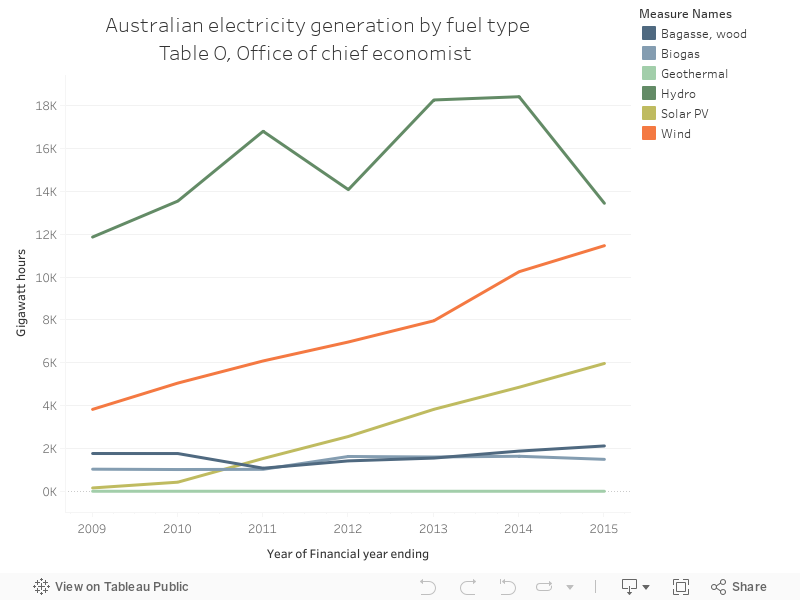
The Australian Department of Industry, Innovation and Science makes a yearly energy statistics report available on their website here. It's full of interesting stuff - below is a selection showing total Australian renewable energy output.
Labels:
Australia,
Energy_Industry,
Fuel,
Industry_Gov,
Output
Thursday, 1 June 2017
052 - Aus energy intensity by state
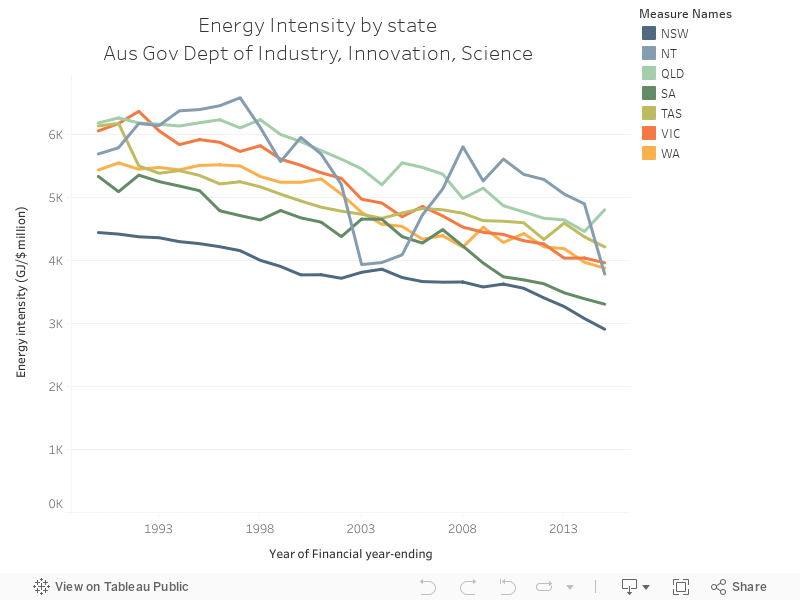
The Office of the Chief Economist's Energy Statistics database is a comprehensive annual long-term look at Australian energy, within the Government's Department of Innovation, Industry and Science. The chart below is extracted from their 2016 report and shows total energy intensity - the number of gigajoules consumed per unit of Gross State Product (GSP).
Wednesday, 31 May 2017
051 - Aus energy consumption per capita by state
The Office of the Chief Economist's Energy Statistics database is a comprehensive annual long-term look at Australian energy, within the Government's Department of Innovation, Industry and Science. The chart below is extracted from their 2016 report and shows total energy consumption per capita.
Subscribe to:
Posts (Atom)