Showing posts with label Thermal. Show all posts

Wednesday, 23 August 2017

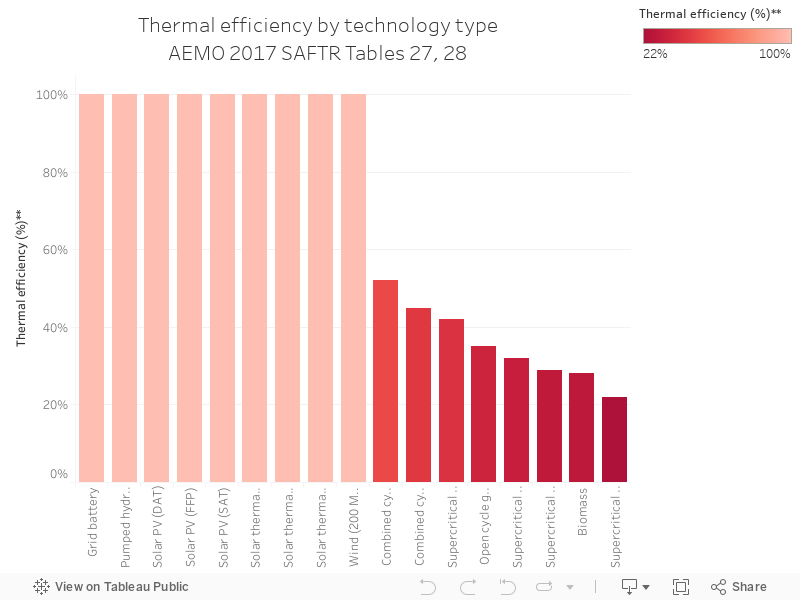
120 - 2017 Thermal efficiency by technology

Charts 116 through to 120 are a series from the Australian Energy Market Operator's South Australian Fuel and Technology Report, 2017, which can be accessed here.

The chart below shows the thermal efficiency of different technologies (sent out high heating value, HHV), which is basically how efficient the machine is at converting fuel to output.


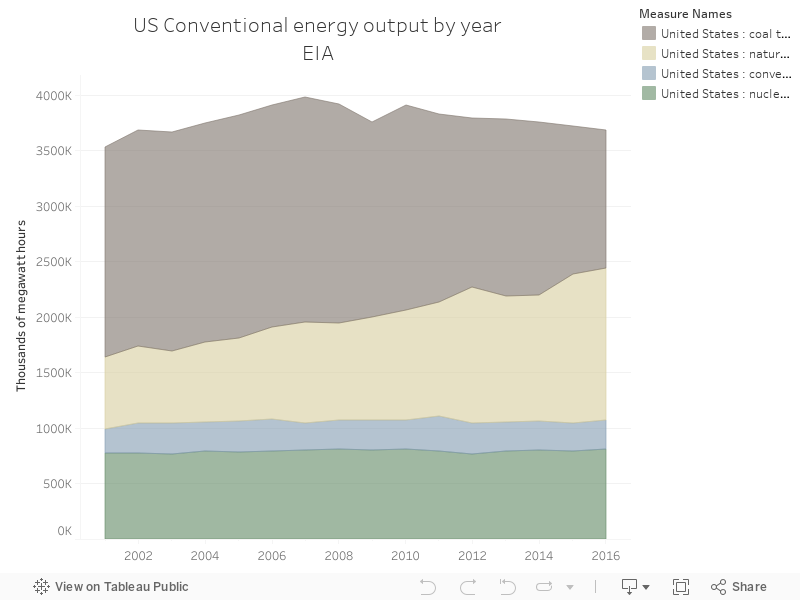
107 - US output - all fuels

Charts 106 through to 115 will be a series based on data from the United States Energy Information administration, with 108 to 115 focusing on solar thermal power stations in the US (South Australia just had an announcement about a big new solar thermal power station).

Today's chart - the early output of all non-renewable, non-hydro power stations from 2001. Simply, coal is phasing out and the gap is being filled by gas.


Wednesday, 14 June 2017

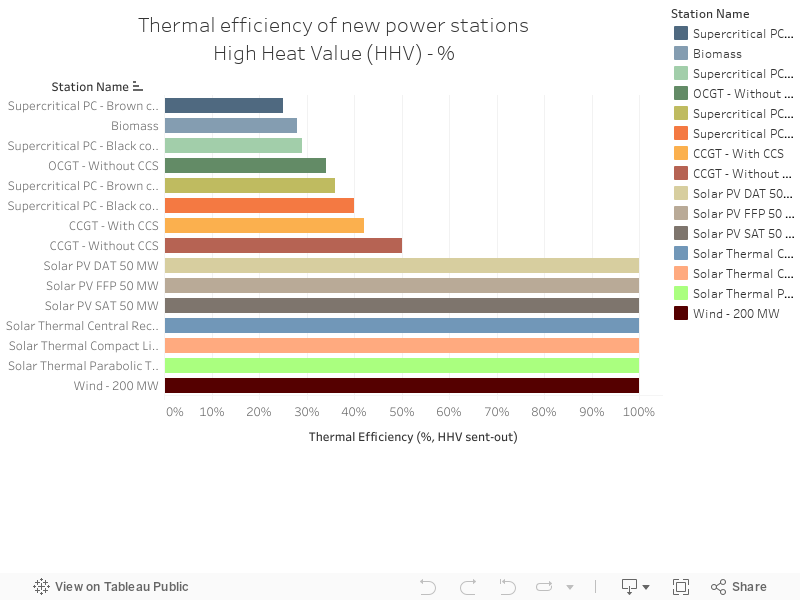
060 - Thermal efficiency

The Australian Electricity Market Operator has a database called the National Transmission Network Development Plan (NTNDP) database - the NTNDP is basically a report that looks at what future grid wires might look  like. There are some detailed, fascinating data points underneath this report.

The chart below shows the thermal efficiency for new power stations in Australia - it's measured in HHV - "High heating value". This is, basically, how much you get out, relative to what you put in.