Showing posts with label Wind. Show all posts

Sunday, 13 August 2017

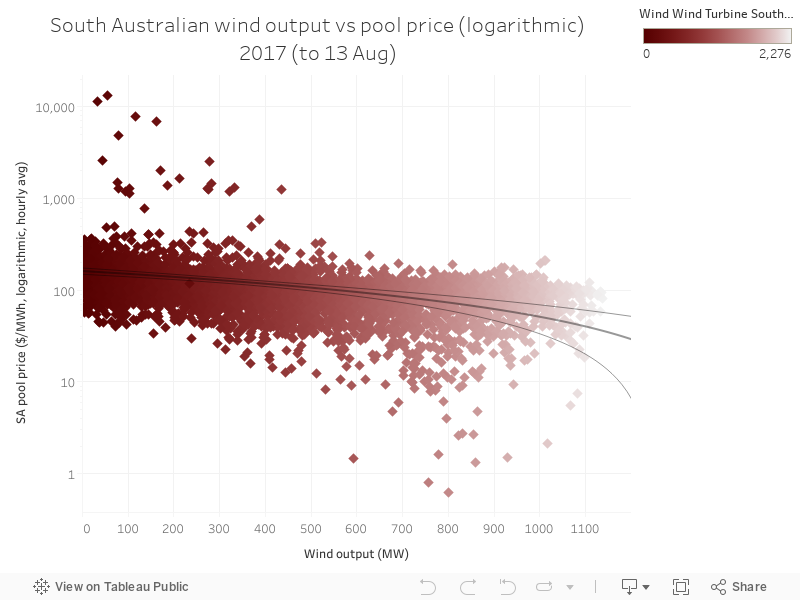
105 - Higher wind output in SA correlates with lower wholesale price

This week, a series on South Australia - all using data from Global Roam's excellent NEM Review software, which you can purchase here.

Today's chart is similar to yesterday's - it shows the relationship between wind power output and wholesale price in South Australia. Unlike yesterday's chart on gas, wind has the opposite effect - as you get more wind power output in each interval, the price ends up lower. This is because wind introduces more competition, has no fuel costs, and also receives revenue from the Renewable Energy Target (RET) scheme - all of these factors mean wind's increasing output results in lower wholesale price in SA. 

This is good, but obviously the impact varies with wind power output in the state. Once wind starts being paired with firming output - including storage technologies - we're going to see some very big changes in this dynamic. Obviously, wind will be slightly more expensive, but at the same time, it'll be dispatchable - and perhaps, as battery costs fall, it might end up even cheaper. Good times. 

Sunday, 9 July 2017

077 - Small wind turbine installations in Australia map

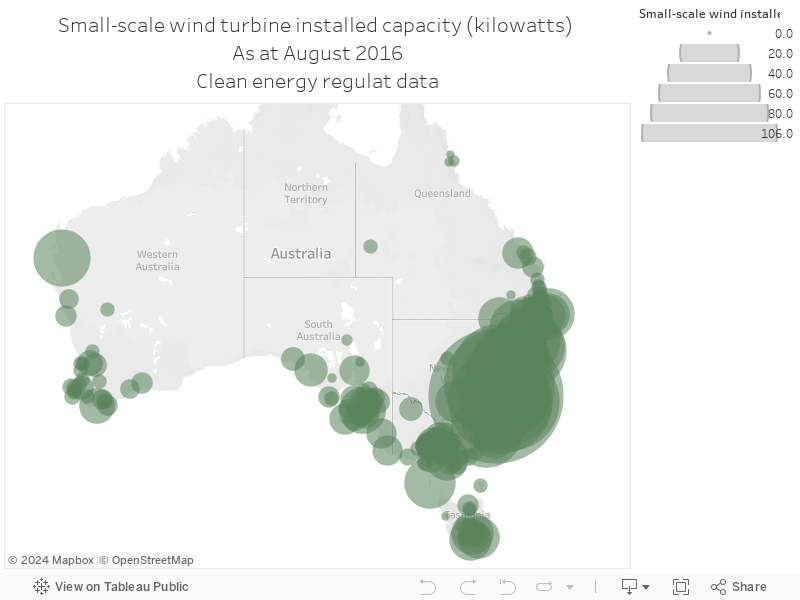
The Clean Energy Regulator makes installation data for small-scale wind turbines available as part of their incentive scheme - the map shows installed capacity by postcode.


Sunday, 25 June 2017

068 - Percent of total time tech online by hour

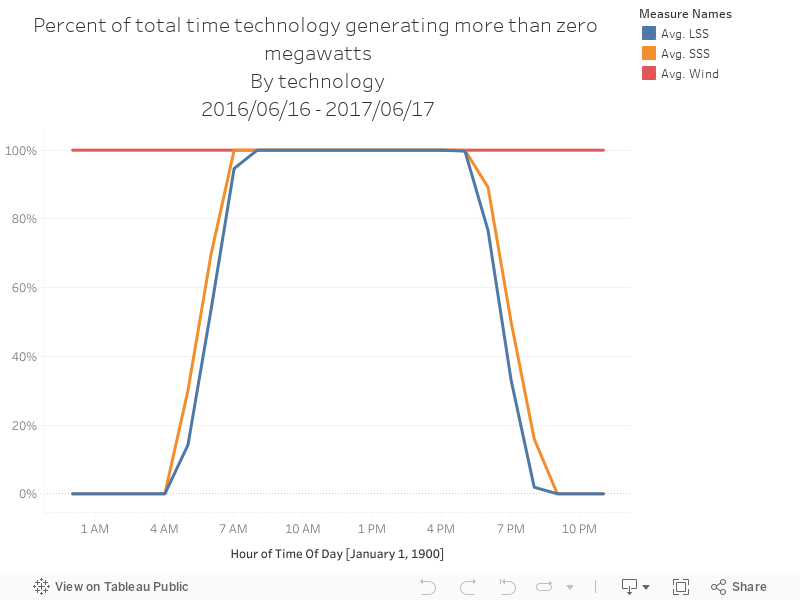
The data below come from a great, useful piece of software called NEM-Review, which shows generation data from machines on the east coast of Australia (WA's excluded).

The chart below shows the percentage of time each technology was generating more than zero megawatts, shown by each one-hour block in the day.


067 - Daily generation profile by renewable technology

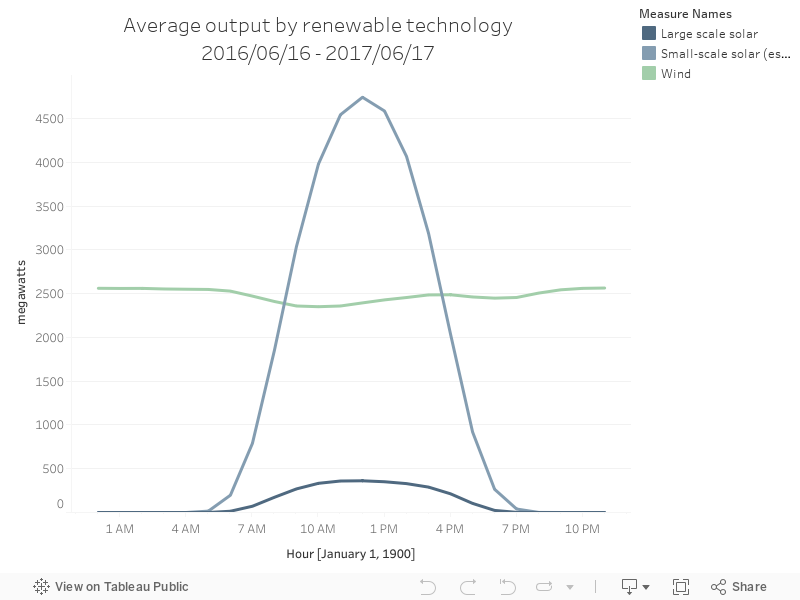
The data below come from a great, useful piece of software called NEM-Review, which shows generation data from machines on the east coast of Australia (WA's excluded)

The chart below shows the daily output of Australian renewable energy technologies, by average megawatts of output.


Wednesday, 7 June 2017

056 - French wind vs UK Wind - distribution

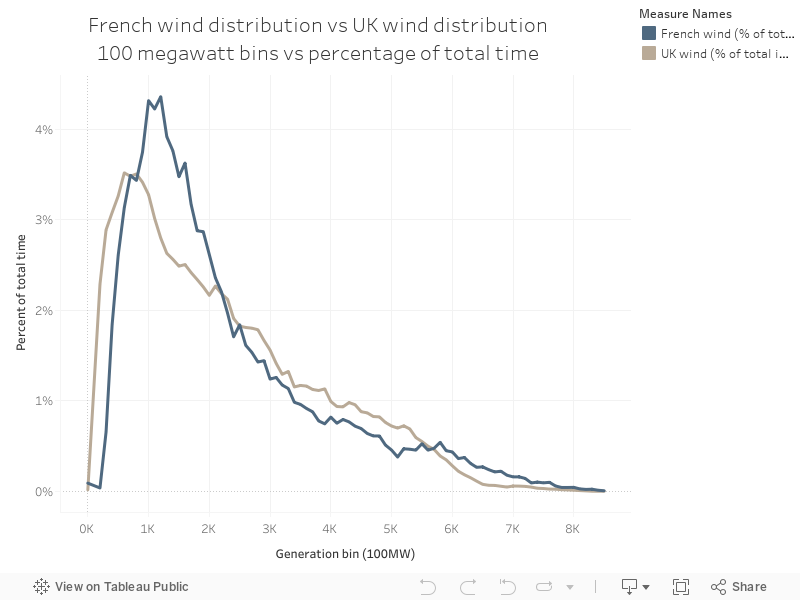
The website Gridwatch makes real-time data available on UK electricity output - I recently discovered French data on there too! You can access it here. France's grid is dominated by nuclear but has a large quantity of electricity exports and imports. The data below are from 20/11/2014 16:45
 to 28/05/2017 7:45, local French time.

The chart below is a comparison of the UK's wind power profile, compared to France's wind power profile (the UK data are from this post).