Showing posts with label Diurnal. Show all posts

Sunday, 10 September 2017

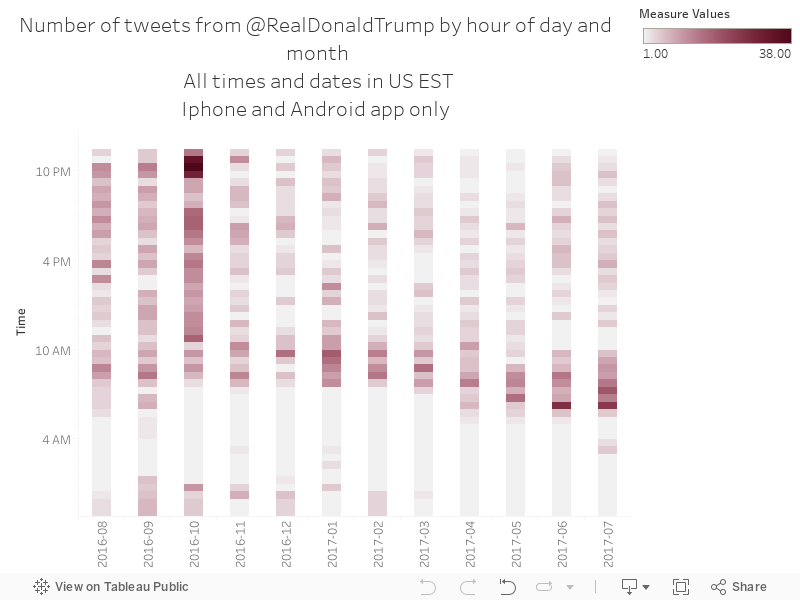
133 - Trumps tweets daily profile by month

Charts 131 to 139 are a series of tweets from a spreadsheet I created that logs tweets from US President Donald Trump, and appends them with some other stats to create analysis. Some things you should know:

- All the charts are in United States Eastern Standard Time
- Sentiment analysis is approximate, but interesting
- The election was on 09/11/2016
- Trump was sworn in on 20/01/2017
- For a long time, Trump was tweeting from his own Android phone - this seemed to completely stop around March 2017. Before that happened, we could draw some interesting insights from the app that the tweets came from
- Most of these charts show a full year, 03/08/2016 to 03/08/2017, unless shown or stated otherwise.

The chart below shows an interesting effect - over the past few months, morning tweets have been getting earlier.
Sunday, 25 June 2017

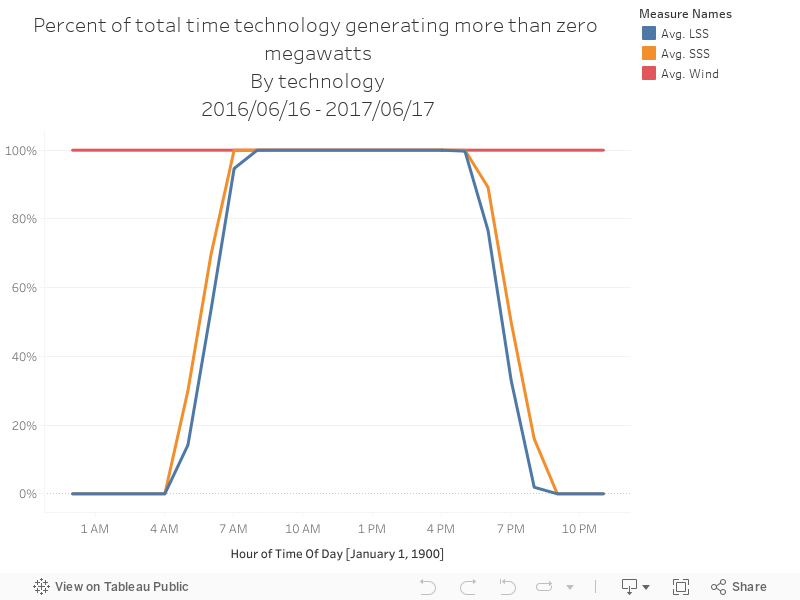
068 - Percent of total time tech online by hour

The data below come from a great, useful piece of software called NEM-Review, which shows generation data from machines on the east coast of Australia (WA's excluded).

The chart below shows the percentage of time each technology was generating more than zero megawatts, shown by each one-hour block in the day.


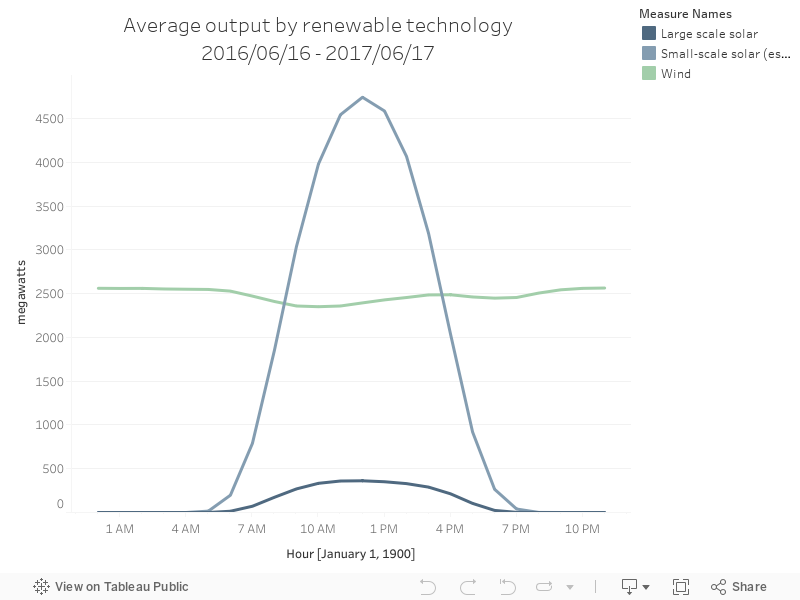
067 - Daily generation profile by renewable technology

The data below come from a great, useful piece of software called NEM-Review, which shows generation data from machines on the east coast of Australia (WA's excluded)

The chart below shows the daily output of Australian renewable energy technologies, by average megawatts of output.


Friday, 9 June 2017

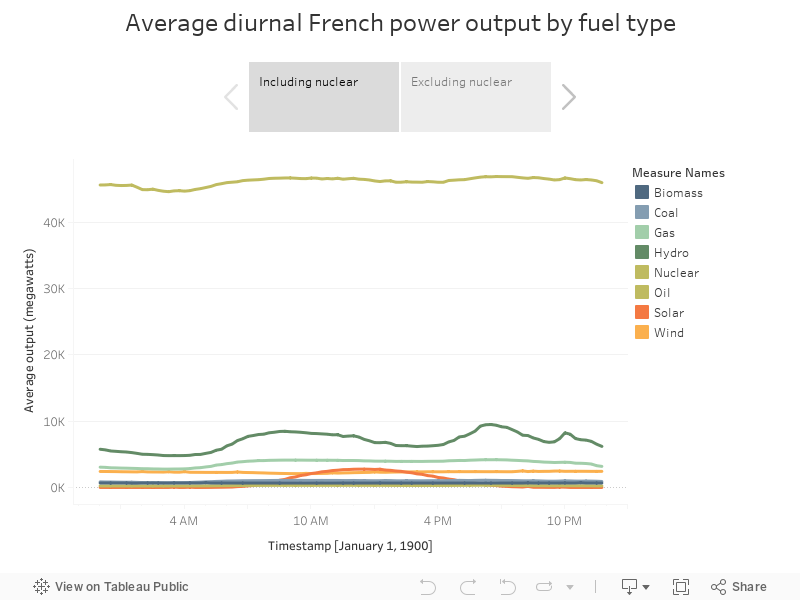
057 - French non-nuclear output distribution

The website Gridwatch makes real-time data available on UK electricity output - I recently discovered French data on there too! You can access it here. France's grid is dominated by nuclear but has a large quantity of electricity exports and imports. The data below are from 20/11/2014 16:45
 to 28/05/2017 7:45, local French time. 

The charts below show power output averaged over that time period, for each 15 minute interval throughout an average day. You can view the data with and without nuclear (to get a closer look at the profiles of the other forms of generation).