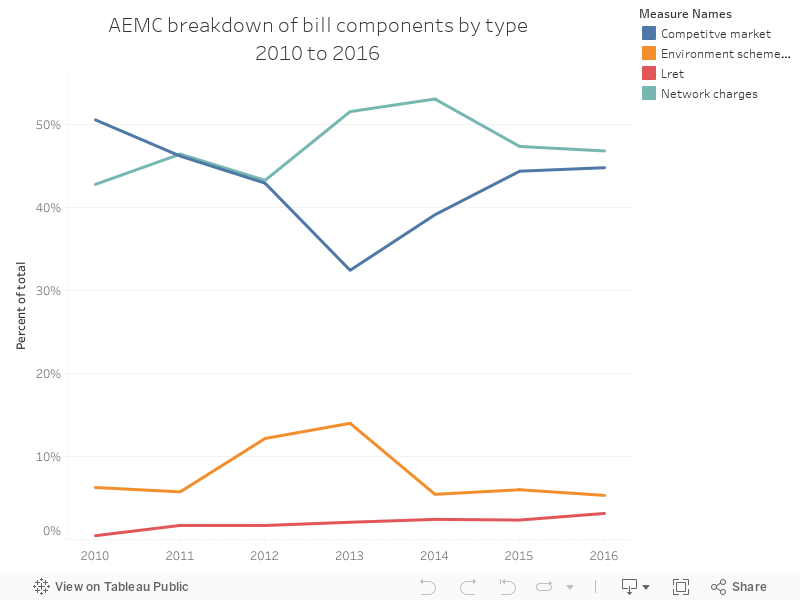
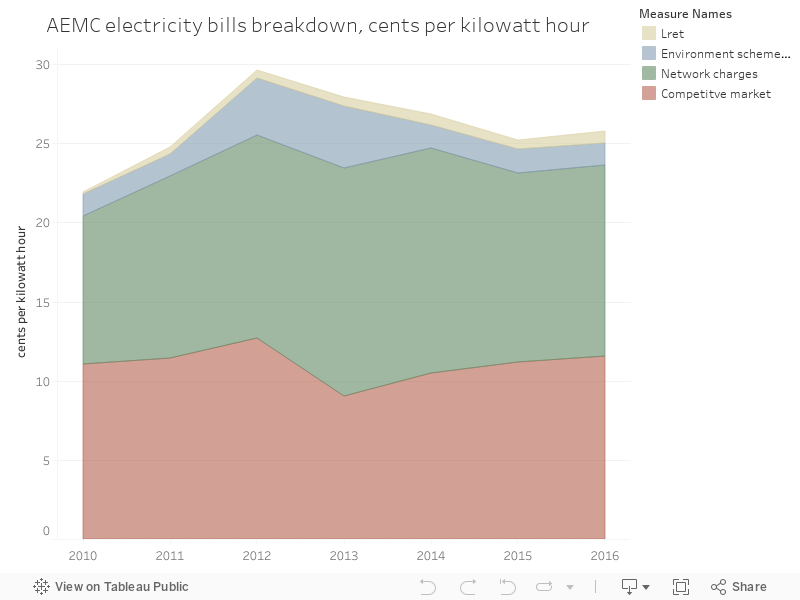
As part of a recent blog post, I gathered up a bunch of data from the Australian Energy Markets Commission's analysis of Australian electricity bills. These charts are an expansion of that analysis.
The chart below shows the breakdown of electricity bills by year, by the total cents per kilowatt hour for each component.
Showing posts with label Components. Show all posts
Thursday, 20 July 2017
91 - AEMC bill breakdown by percent of total
As part of a recent blog post, I gathered up a bunch of data from the Australian Energy Markets Commission's analysis of Australian electricity bills. These charts are an expansion of that analysis.
The chart below shows a breakdown of electricity bills, shown as a percentage.
Subscribe to:
Posts (Atom)