The Mojave solar project is another US solar thermal power station - the data below show capacity factor by month
Showing posts with label Solar_Thermal. Show all posts
Wednesday, 23 August 2017
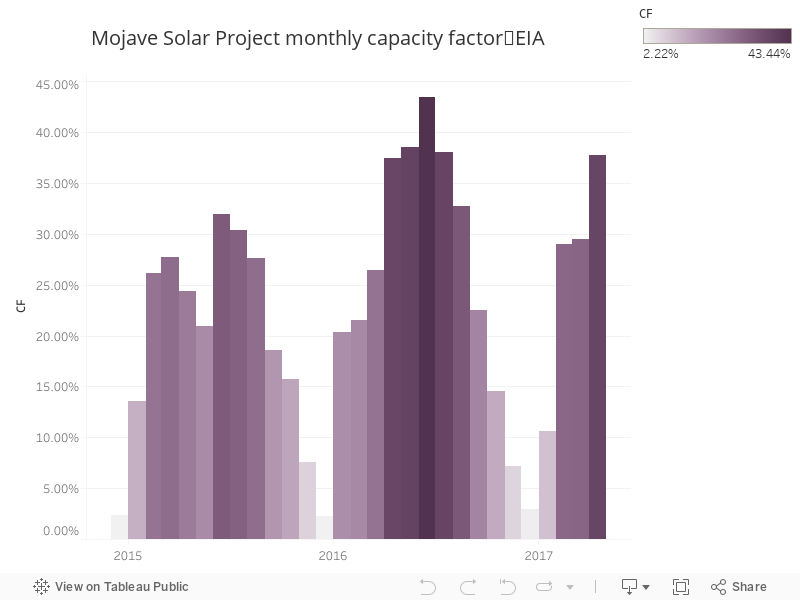
115 - Mojave monthly capacity factor
Charts 106 through to 115 will be a series based on data from the United States Energy Information administration, with 108 to 115 focusing on solar thermal power stations in the US (South Australia just had an announcement about a big new solar thermal power station).
The Mojave solar project is another US solar thermal power station - the data below show capacity factor by month
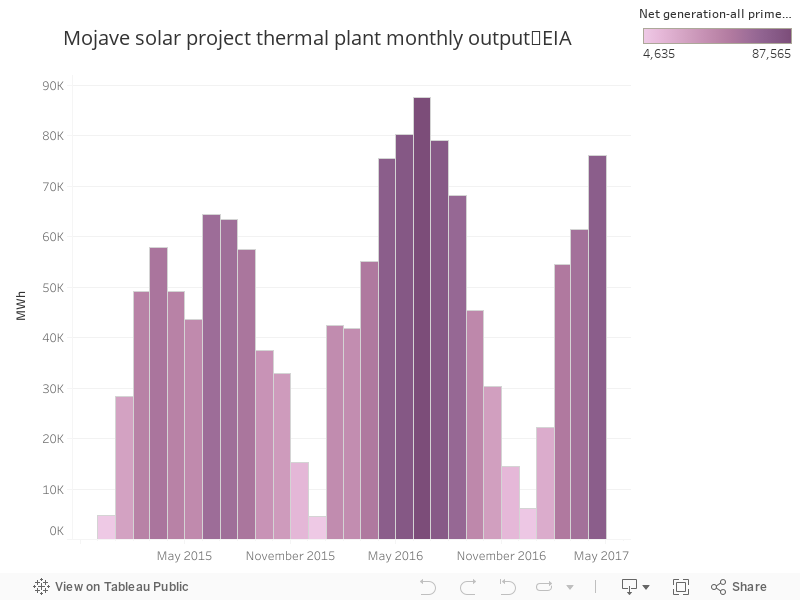
114 - Mojave monthly output
Charts 106 through to 115 will be a series based on data from the United States Energy Information administration, with 108 to 115 focusing on solar thermal power stations in the US (South Australia just had an announcement about a big new solar thermal power station).
The Mojave solar project is another US solar thermal power station - the data below show output by month
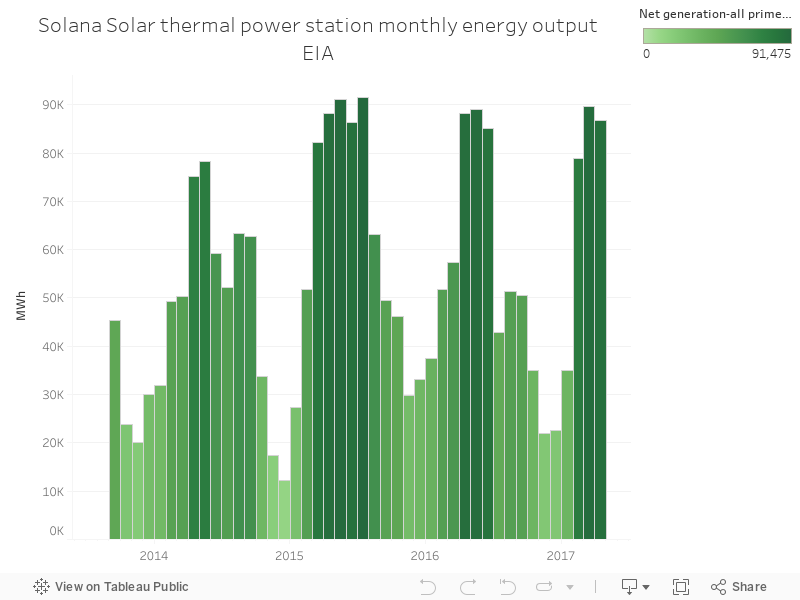
112 - Solana Monthly Output
Charts 106 through to 115 will be a series based on data from the United States Energy Information administration, with 108 to 115 focusing on solar thermal power stations in the US (South Australia just had an announcement about a big new solar thermal power station).
Solana solar thermal power station in the US uses a parabolic trough - mirrors pointed at a pipe - instead of concentrating sunlight using mirrors on a single receiver. The chart below shows monthly output for the power station going back to the start of operation.
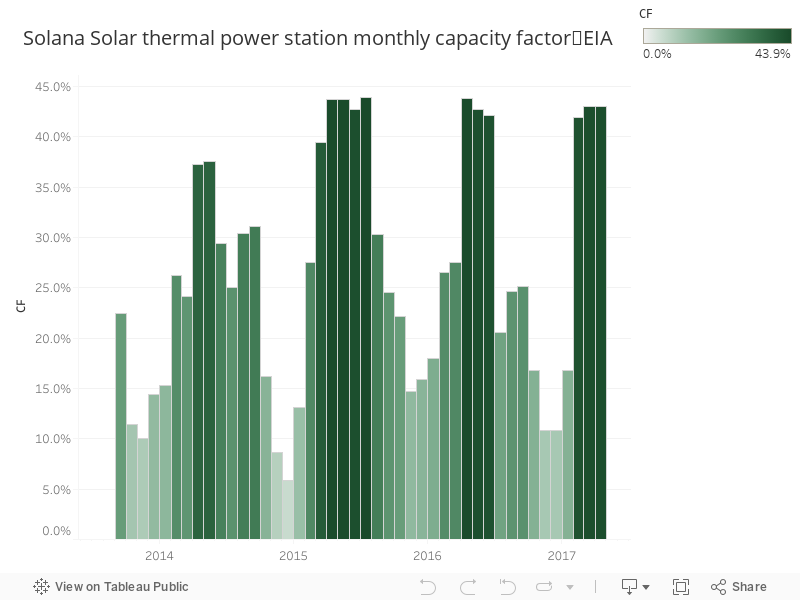
113 - Solana Monthly CF
Charts 106 through to 115 will be a series based on data from the United States Energy Information administration, with 108 to 115 focusing on solar thermal power stations in the US (South Australia just had an announcement about a big new solar thermal power station).
Solana solar thermal power station in the US uses a parabolic trough - mirrors pointed at a pipe - instead of concentrating sunlight using mirrors on a single receiver. The chart below shows monthly capacity factor for the power station going back to the start of operation.
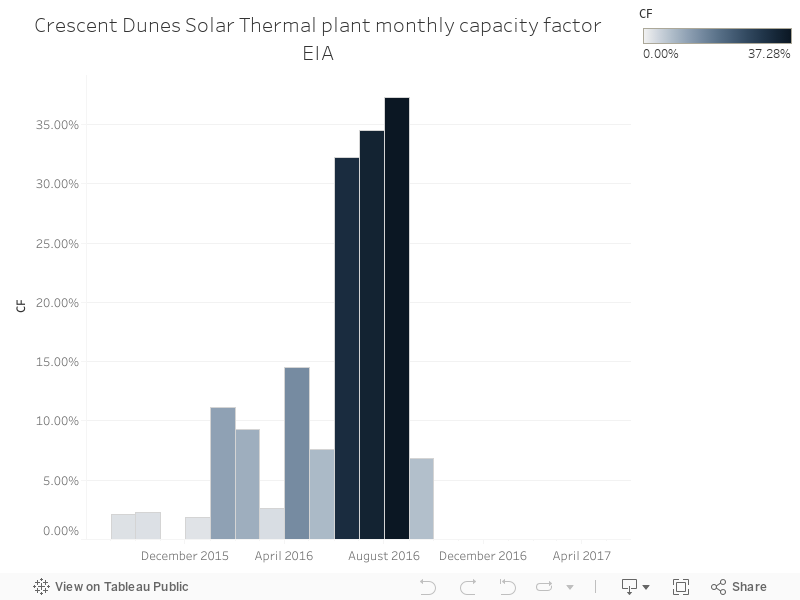
111 - Cresent Dunes Capacity Factor
Charts 106 through to 115 will be a series based on data from the United States Energy Information administration, with 108 to 115 focusing on solar thermal power stations in the US (South Australia just had an announcement about a big new solar thermal power station).
Crescent Dunes is a US solar thermal plant quite similar to SA's proposed facility, to be built by the same company, Solar Reserve. It's seen some major downtime since late last year, but is reportedly up and running now. The chart below shows monthly capacity factor.
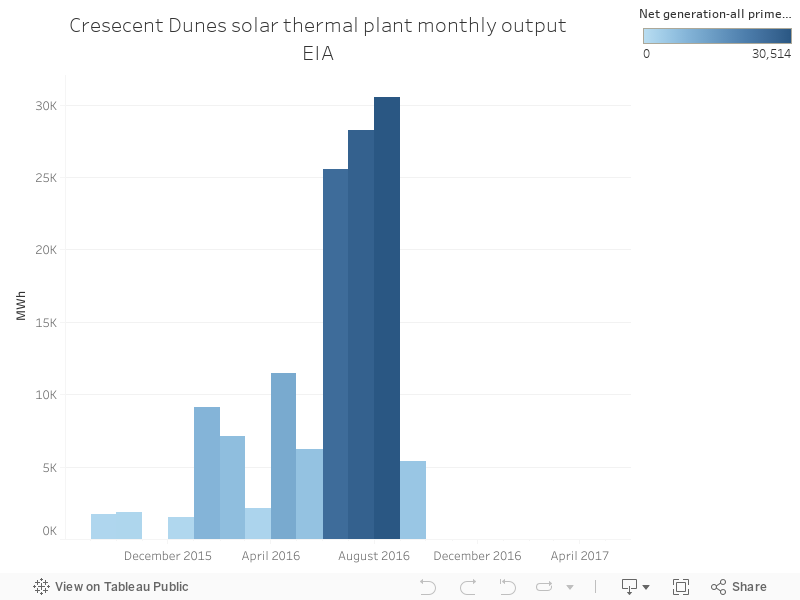
110 - Cresecent Dunes monthly output
Charts 106 through to 115 will be a series based on data from the United States Energy Information administration, with 108 to 115 focusing on solar thermal power stations in the US (South Australia just had an announcement about a big new solar thermal power station).
Crescent Dunes is a US solar thermal plant quite similar to SA's proposed facility, to be built by the same company, Solar Reserve. It's seen some major downtime since late last year, but is reportedly up and running now. The chart below shows monthly output back to the start of operation for the plant.
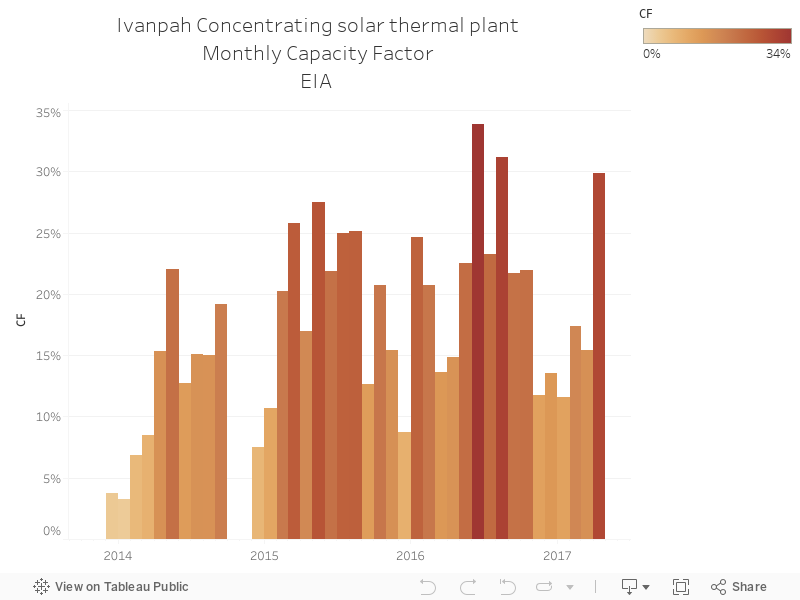
109 - Ivanpah CF per month
Charts 106 through to 115 will be a series based on data from the United States Energy Information administration, with 108 to 115 focusing on solar thermal power stations in the US (South Australia just had an announcement about a big new solar thermal power station).
Below, a chart showing the monthly capacity factor (actual output vs possible output) of Ivanpah solar thermal power station (it's made up of three sections, with a total capacity of 392 MW).
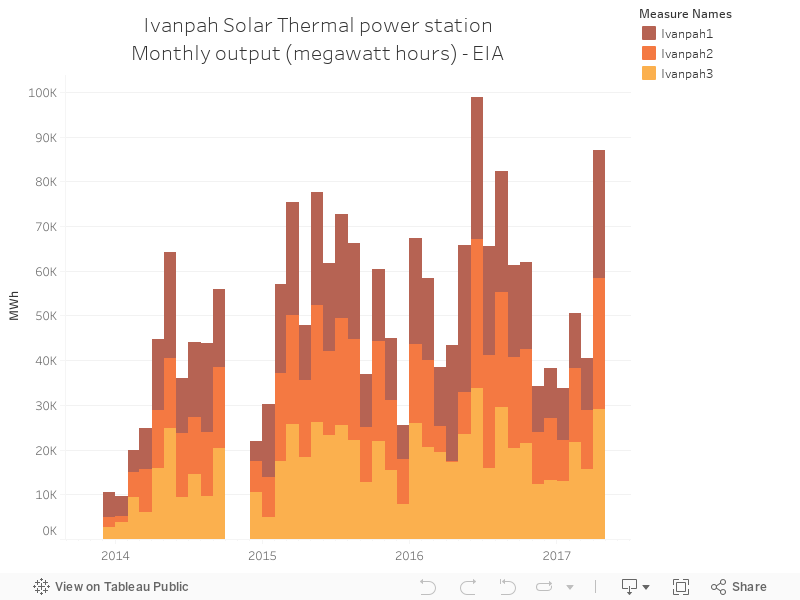
108 - Ivanpah monthly output
Charts 106 through to 115 will be a series based on data from the United States Energy Information administration, with 108 to 115 focusing on solar thermal power stations in the US (South Australia just had an announcement about a big new solar thermal power station).
Below, a chart showing the monthly output of Ivanpah solar thermal power station (it's made up of three sections, with a total capacity of 392 MW).
Subscribe to:
Posts (Atom)