Sunday 30 April 2017

028 - One Nation voters are almost entirely born in Australia

Only 2% of One Nation voters are born outside of Australia - vastly different to the other parties (with the Liberal party having the largest contingent of foreign-born voters).

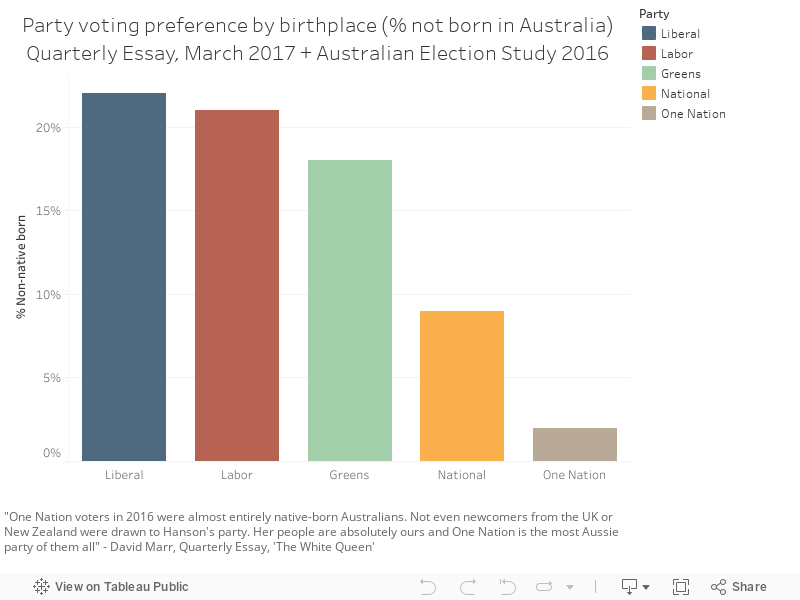
These data are from the latest Quarterly Essay as determined by the Australian Election Study 2016.


Thursday 27 April 2017

027 - Renewable energy dominates support for different types of climate action

A survey by Essential Media shows that, for quite some time, renewable energy dominates the options. Source.


Wednesday 26 April 2017

026 - The UK's fascinating forecasts of capacity growth

The UK government's Department for Business, Energy & Industrial Strategy (BEIS) published a bunch of forecasts recently - the chart below shows the varied capacities of technologies they forecast will dominate their electricity system. Source.


Tuesday 25 April 2017

025 - UK Electricity demand forecasts dominated by business and homes

The UK's BEIS government department released forecasts for 2016 onwards - the chart below, from their data, shows that they suspect the bulk of electricity demand will come from homes and businesses. Source.


Sunday 23 April 2017

024 - The death of coal in the UK will be in 2021

A few days ago, the UK just went it's first 24-hour period without burning coal since the beginning of the industrial revolution.

The UK government's Department for Business, Energy and Industrial Strategy (BEIS) recently publish projections of greenhouse gas emissions and energy demand, from 2016 to 2035. Annex J of their report shows the precise moment they except to switch off their coal supplies. It'll be a historic moment.

Source.


Thursday 20 April 2017

023 - DC's superhero films are critical failures. Marvel's films are not

Comparing Marvel's superhero franchise to DC's newer attempt to emulate the same shows how terrible DC's films are. Source - Rotten Tomatoes.


Wednesday 19 April 2017

022 - Fukushima eroded trust in nuclear power

Using the same study as yesterday's chart of the day (021), the chart below shows how trust in nuclear, and the authorities regulating it, eroded after Fukushima.


Tuesday 18 April 2017

021 - Fukushima impacted Australian views on nuclear and renewables

This study, published in 2014, highlights some changes attitudes in Australia - measuring views on nuclear and other energy types before and after.

Their findings include the data below - fewer people accept the construction of nuclear power stations, even if it helps with climate change, along with a slight increase in the number of people who want renewables to be the primary method for tackling climate change.

As the authors say,
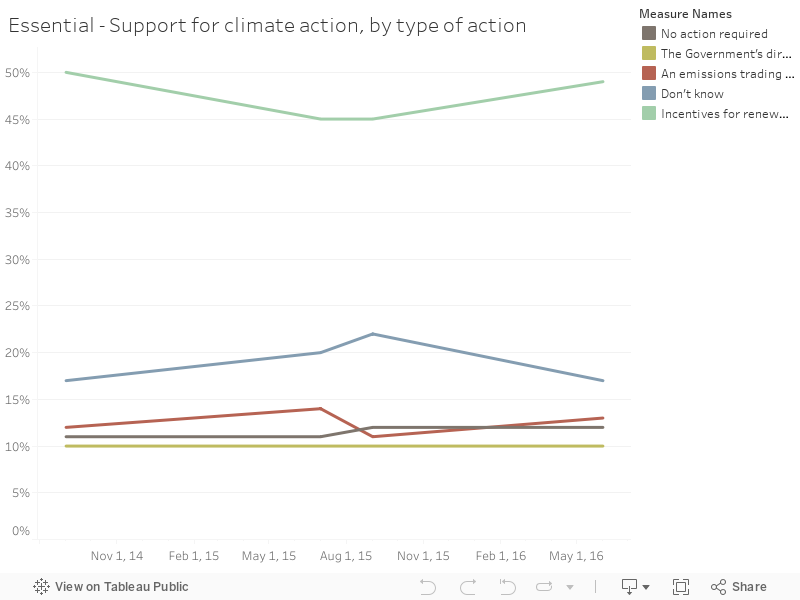
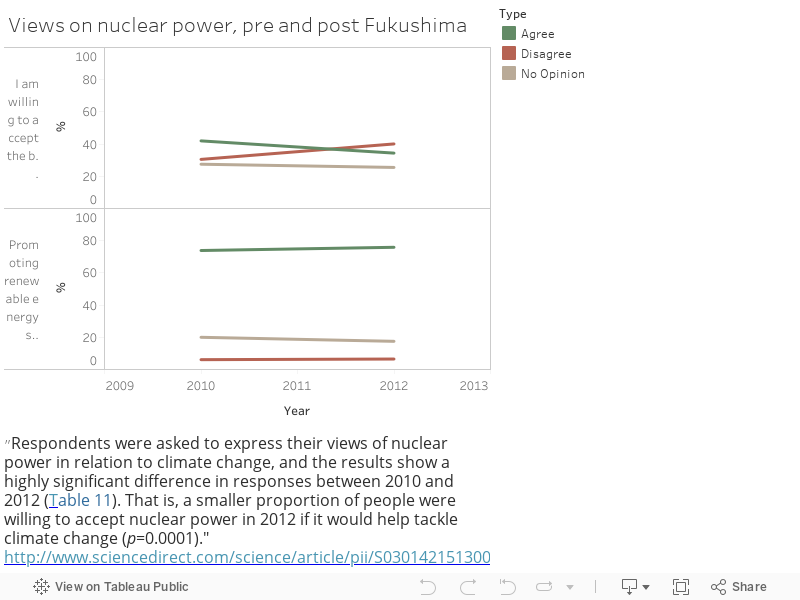
"Expanding the use of renewable energy sources (71%) remains the most popular option, followed by energy-efficient technologies (58%) and behavioural change (54%). Opposition to nuclear power will continue to be an obstacle against its future development even when posed as a viable solution to climate change"
Whether you're pro or anti nuclear, the public's attitude towards this technology is a major part of what role it'll play in the future, in Australia. 

Monday 17 April 2017

020 - Public support for SA's energy plan is surprisingly apolitical

South Australia's energy plan announced recently - as you might expect, it drew a flurry of coverage, criticism and support.

Most interesting to me has been the general public's response - it's a plan that's well supported by most people, regardless of who they vote for. This is quite unique in Australia energy policy, with most plans, measures and policies featuring distinct differences between parties. Not so, with this one.

Source.


Wednesday 12 April 2017

019 - SA - output by fuel type

A simple chart below showing the average monthly output of South Australia sources of electricity, in megawatts, for the decade and a half (ish) - notable for the decline of coal, upswing of wind and up and down of interconnector flows. Source - NEM-Review.


Tuesday 11 April 2017

018 - Renewable energy jobs by year, by state - interactive chart

The last chart from a series on the ABS' latest release on renewable energy jobs. The chart below is an explorer tool to dig into the data by state. Source.


Monday 10 April 2017

017 - Queensland dominates rooftop PV penetration

As part of the ABS' recent data release on employment, an update of recent installation data on rooftop-PV was included, shown below. Queensland dominates. It's very sunny there.

Source.


Sunday 9 April 2017

016 - Employment in renewables by technology type

Recently, the Australian Bureau of Statistics released a snapshot of employment in renewable energy in Australia, with some fascinating insights broken down by industry below. The industry has risen, and fallen, largely due to the fluctuations in the deployment of rooftop-scale PV.

Source.


Thursday 6 April 2017

015 - Trust in media declines, but rankings stay the same

Essential Media's survey measures trust in media - something's that's become intensely relevant since populist politicians and parties stake significant time and effort attacking the fourth estate. The chart below shows trust by outlet type in Australia over the past three years. Source

"How much trust do you have in what you read or hear in the following media?"

Total of "A lot / some trust":

Wednesday 5 April 2017

014 - Distribution frequencies for different fuels in the UK

These charts show the number of five minute intervals each fuel spends at a certain level of output, with each bin showing the 'ceiling' of that range (either averaged to 100 or 1,000 megawatts, depending on the fuel type).

I've included frequency, demand and interconnection too. It's interesting to see the UK spending a lot of time importing electricity, and that frequency is more often lower than 50Hz, suggesting demand is slightly higher than generation, on average. But not by much.

Source


Tuesday 4 April 2017

013 - The UK imports a fair amount of electricity

The United Kingdom is electrically connected to four different regions - France (two gigawatts), the Netherlands (one gigawatt), Northern Ireland (500 megawatts) and the Republic of Ireland (500 megawatts, 'East-West'). The chart below, sourced from Gridwatch in the UK, shows variations in the average flow across these four interconnections over the past few years. You can see real-time data here.


Monday 3 April 2017

012 - The decline of coal-fired power in the UK

The United Kingdom has used a range of different fuel types to reduce their reliance on coal-fired power, and as such, emissions in the UK are dropping to their lowest levels since the 19th century. The chart below, via Gridwatch, shows the mix of fuel types in the UK over the past few years. The next few charts will explore UK electricity, too.


Sunday 2 April 2017

011 - Earth hour's impact across the states and the years

Earth hour saw its tenth year - a popular event, but one that's been under increasing scrutiny since it's inception in 2007.

The chart below shows demand, either by total for the NEM or state-by-state, for each earth-hour day in those past ten years, compared to the average March Saturday for that year. In some instances, total demand during the day is lower than the average - but impact on demand during the designated hour is usually hard to detect - which reinforces the symbolic nature of the event. Data via NEM-Review.