Showing posts with label Consumption. Show all posts
Showing posts with label Consumption. Show all posts
Tuesday, 20 June 2017
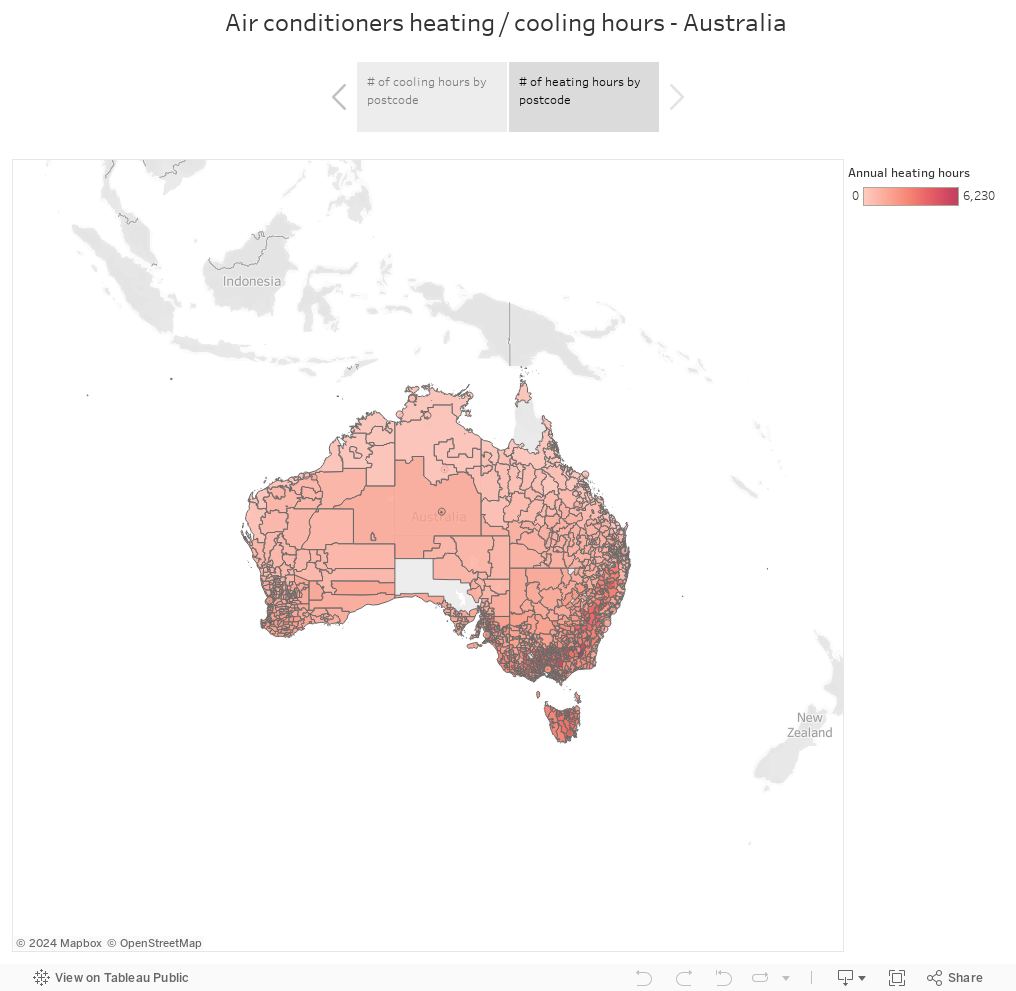
064 - Australian air-conditioner usage map
This great data set shows total hours of cooling and heating in Australia over the course of a year, available here. Its sorted by postcode, so I've made them into a map below.

Wednesday, 31 May 2017
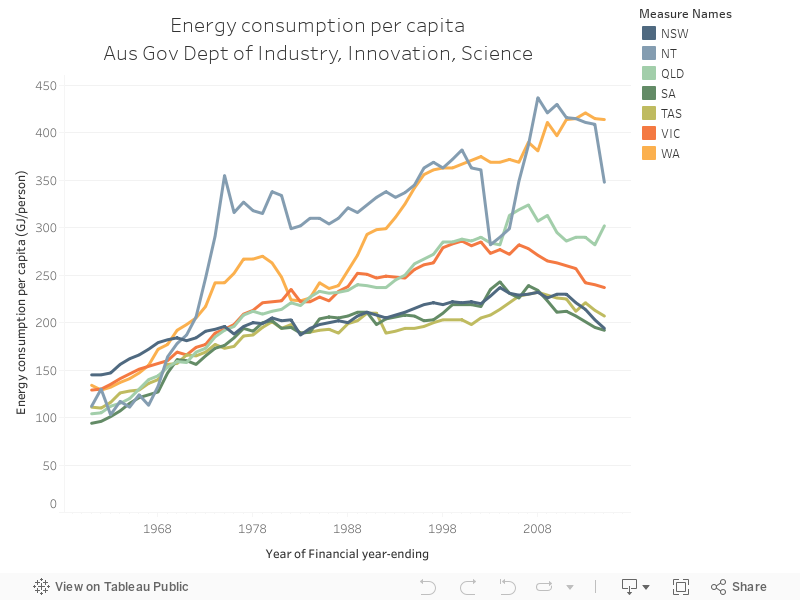
051 - Aus energy consumption per capita by state
The Office of the Chief Economist's Energy Statistics database is a comprehensive annual long-term look at Australian energy, within the Government's Department of Innovation, Industry and Science. The chart below is extracted from their 2016 report and shows total energy consumption per capita.
Tuesday, 25 April 2017
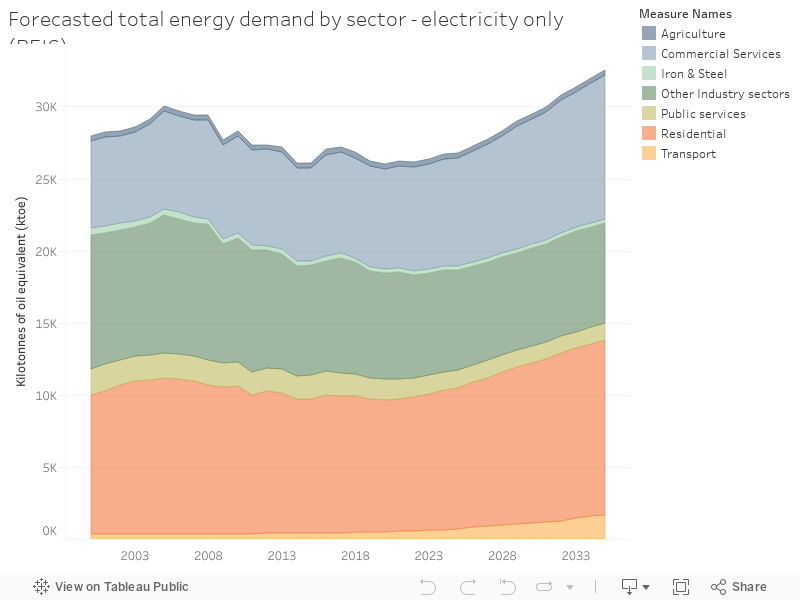
025 - UK Electricity demand forecasts dominated by business and homes
The UK's BEIS government department released forecasts for 2016 onwards - the chart below, from their data, shows that they suspect the bulk of electricity demand will come from homes and businesses. Source.
Sunday, 2 April 2017
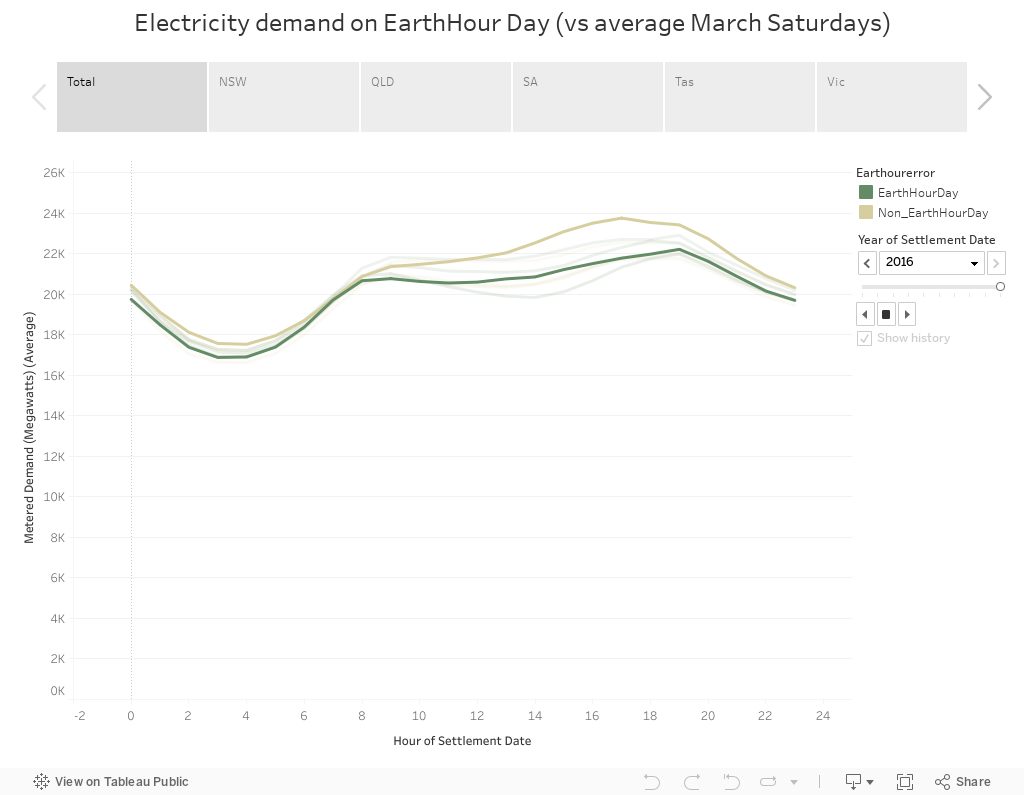
011 - Earth hour's impact across the states and the years
Earth hour saw its tenth year - a popular event, but one that's been under increasing scrutiny since it's inception in 2007.
The chart below shows demand, either by total for the NEM or state-by-state, for each earth-hour day in those past ten years, compared to the average March Saturday for that year. In some instances, total demand during the day is lower than the average - but impact on demand during the designated hour is usually hard to detect - which reinforces the symbolic nature of the event. Data via NEM-Review.
The chart below shows demand, either by total for the NEM or state-by-state, for each earth-hour day in those past ten years, compared to the average March Saturday for that year. In some instances, total demand during the day is lower than the average - but impact on demand during the designated hour is usually hard to detect - which reinforces the symbolic nature of the event. Data via NEM-Review.
Monday, 27 March 2017
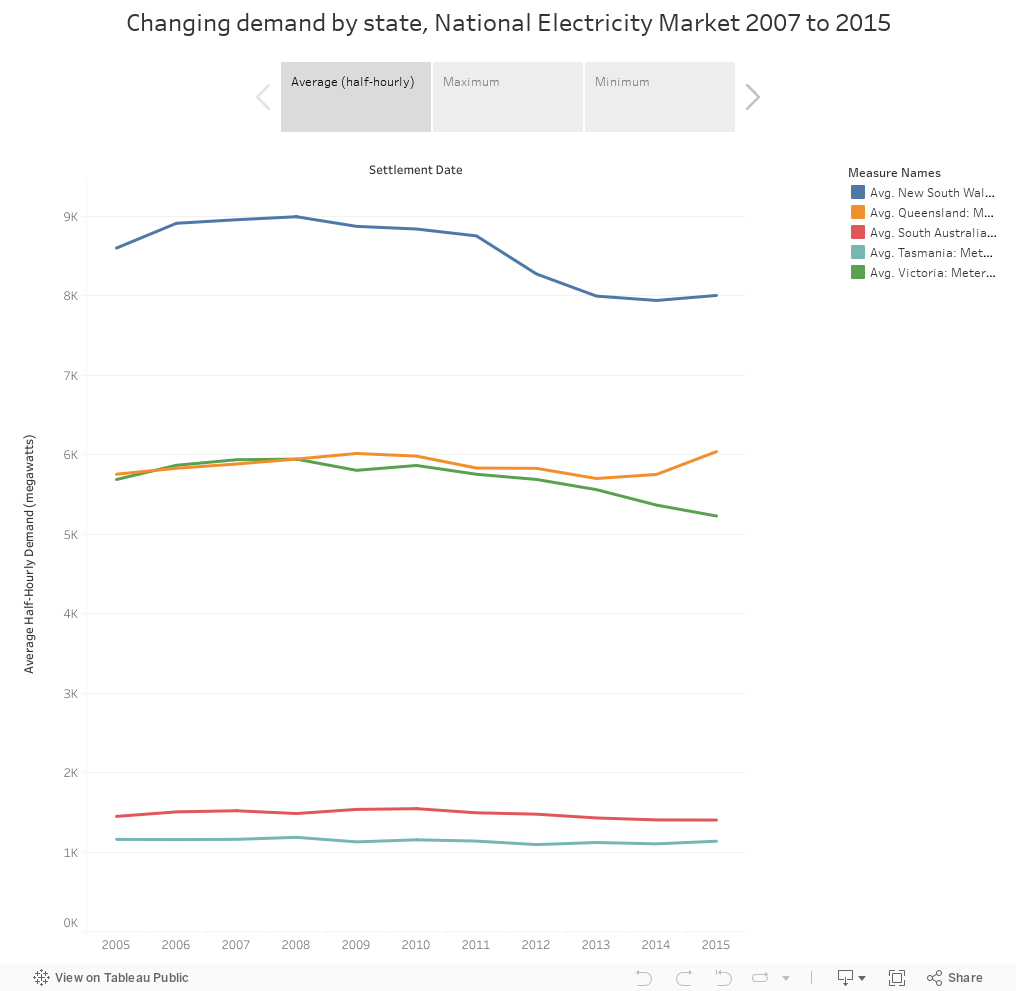
007 - Decreasing demand in the National Electricity Market - but peaks haven't changed that much
How has demand changed in the Australian NEM over the past few years? The chart below splits that up by state, and includes minimum and maximum half-hourly demand for each year. Read the market operator's demand forecasting report here - data below via NEM-review, Demand is down, but the maximums haven't changed to quite the same degree.
Subscribe to:
Posts (Atom)