Showing posts with label Tech. Show all posts

Wednesday, 23 August 2017

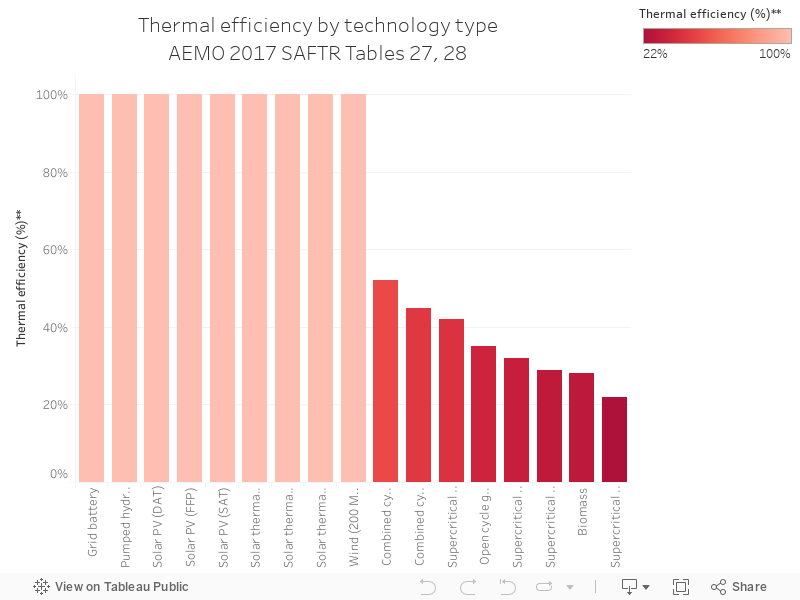
120 - 2017 Thermal efficiency by technology

Charts 116 through to 120 are a series from the Australian Energy Market Operator's South Australian Fuel and Technology Report, 2017, which can be accessed here.

The chart below shows the thermal efficiency of different technologies (sent out high heating value, HHV), which is basically how efficient the machine is at converting fuel to output.


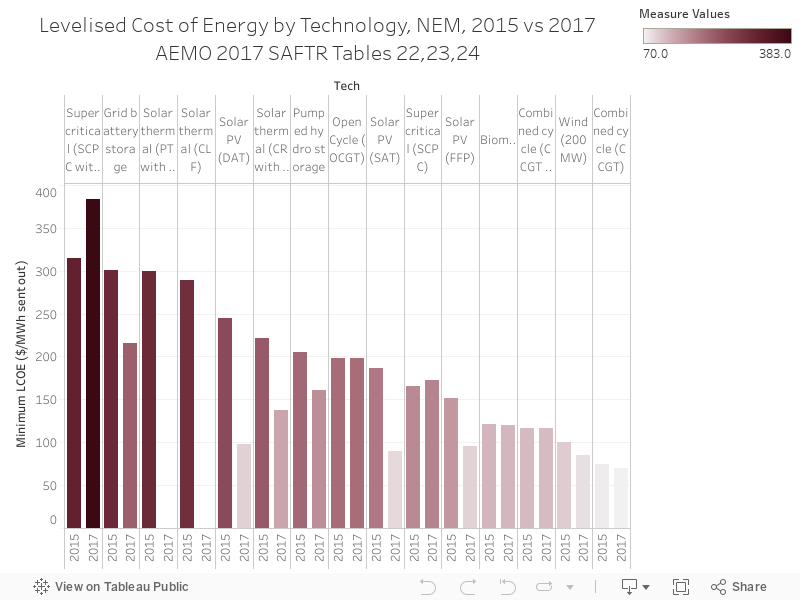
119 - Tech min LCoE, 2015 vs 2017

Charts 116 through to 120 are a series from the Australian Energy Market Operator's South Australian Fuel and Technology Report, 2017, which can be accessed here.

The chart below shows the levelised cost of energy (LCoE) by technology, comparing 2015 to 2017. Grid battery storage is up the top, but it's also seen the biggest drop in cost in two years out of all technologies.
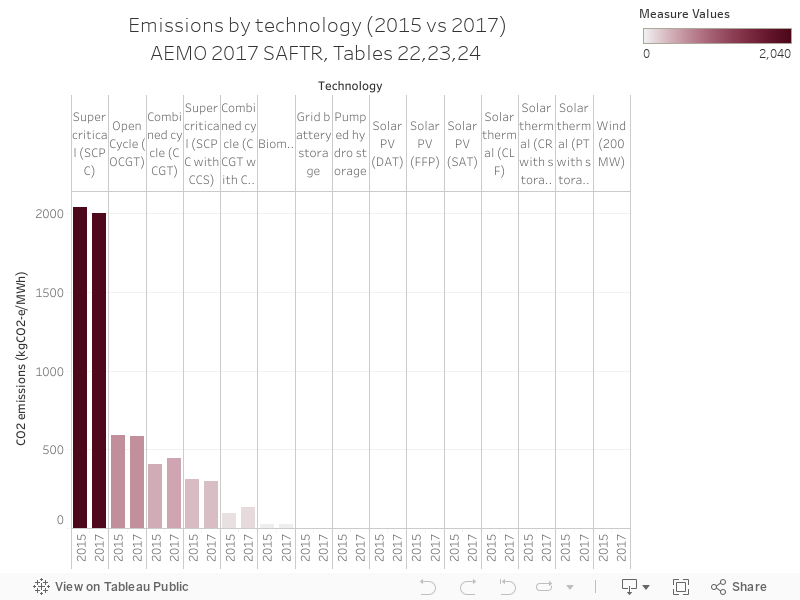
118 - Tech emissions, 2015 vs 2017

Charts 116 through to 120 are a series from the Australian Energy Market Operator's South Australian Fuel and Technology Report, 2017, which can be accessed here.

Today's chart shows emissions intensity for every unit of ouput by technology, with super-critical coal at the top of the the list.