Monday, 23 October 2017
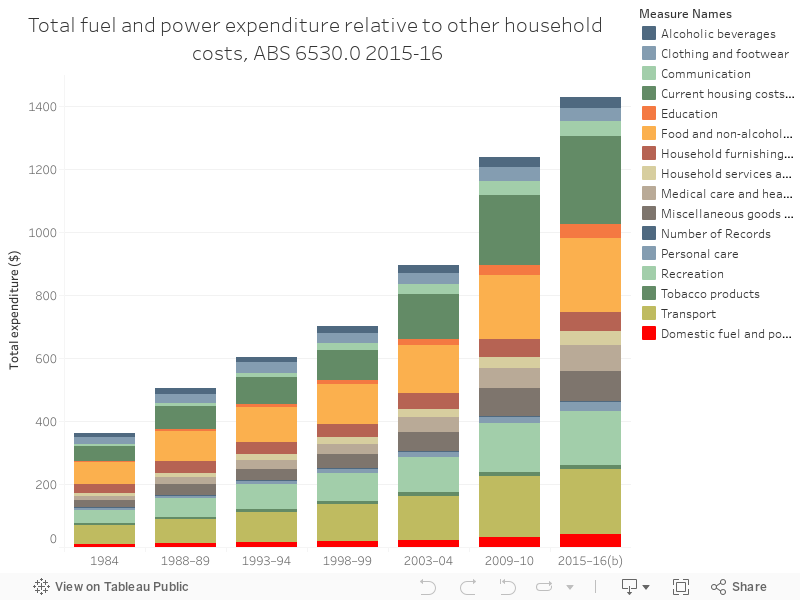
140 - Household power and fuel costs - 1984 - 2016
The history of household spending on power and electricity in Australia, going back quite some time. Source

Sunday, 10 September 2017
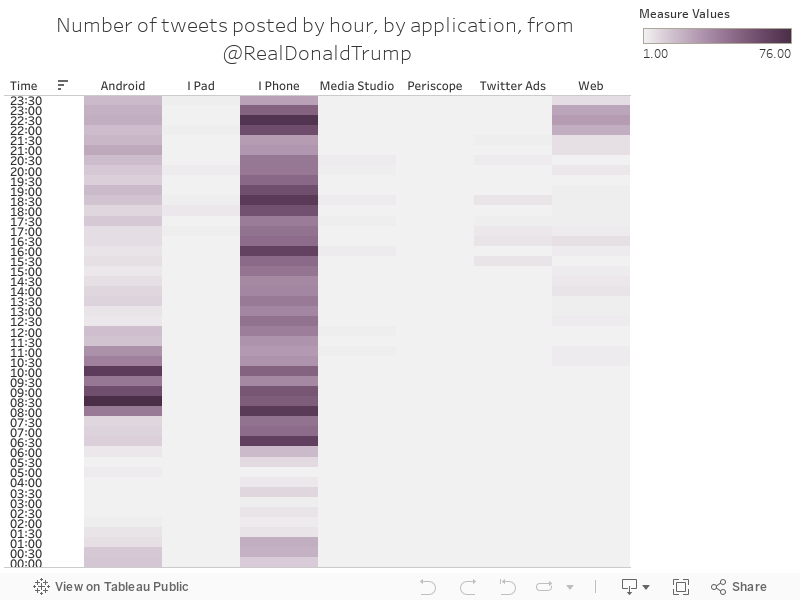
139 - Daily profile by app
Charts 131 to 139 are a series of tweets from a spreadsheet I created that logs tweets from US President Donald Trump, and appends them with some other stats to create analysis. Some things you should know:
- All the charts are in United States Eastern Standard Time
- Sentiment analysis is approximate, but interesting
- The election was on 09/11/2016
- Trump was sworn in on 20/01/2017
- For a long time, Trump was tweeting from his own Android phone - this seemed to completely stop around March 2017. Before that happened, we could draw some interesting insights from the app that the tweets came from
- Most of these charts show a full year, 03/08/2016 to 03/08/2017, unless shown or stated otherwise.
The chart below shows the number of tweets posted by half-hour chunks, sorted by app - with Android tweets coming earlier in the morning and iPhone tweets spread quite equally.
- All the charts are in United States Eastern Standard Time
- Sentiment analysis is approximate, but interesting
- The election was on 09/11/2016
- Trump was sworn in on 20/01/2017
- For a long time, Trump was tweeting from his own Android phone - this seemed to completely stop around March 2017. Before that happened, we could draw some interesting insights from the app that the tweets came from
- Most of these charts show a full year, 03/08/2016 to 03/08/2017, unless shown or stated otherwise.
The chart below shows the number of tweets posted by half-hour chunks, sorted by app - with Android tweets coming earlier in the morning and iPhone tweets spread quite equally.
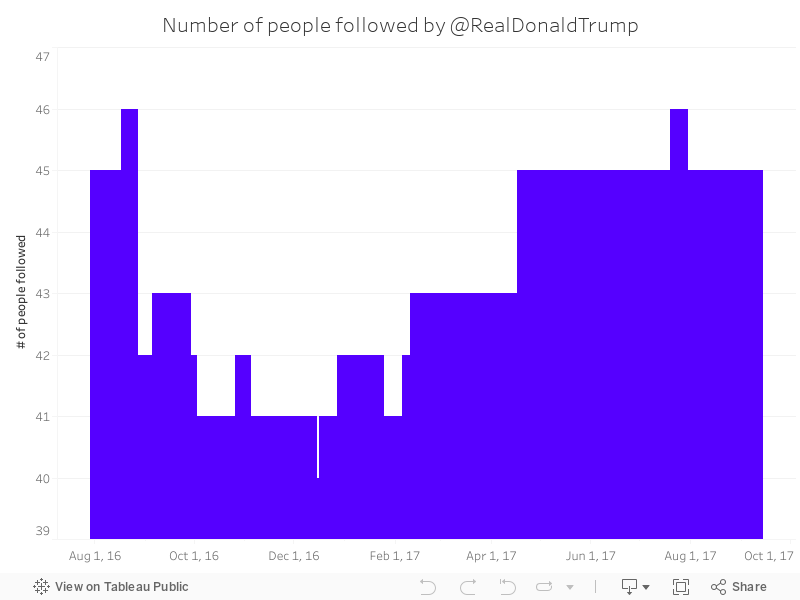
138 - Trumptweets - # of people being followed by RDT
Charts 131 to 139 are a series of tweets from a spreadsheet I created that logs tweets from US President Donald Trump, and appends them with some other stats to create analysis. Some things you should know:
- All the charts are in United States Eastern Standard Time
- Sentiment analysis is approximate, but interesting
- The election was on 09/11/2016
- Trump was sworn in on 20/01/2017
- For a long time, Trump was tweeting from his own Android phone - this seemed to completely stop around March 2017. Before that happened, we could draw some interesting insights from the app that the tweets came from
- Most of these charts show a full year, 03/08/2016 to 03/08/2017, unless shown or stated otherwise.
The chart below shows, at each point during the period, how many people the @RealDonaldTrump account was following:
- All the charts are in United States Eastern Standard Time
- Sentiment analysis is approximate, but interesting
- The election was on 09/11/2016
- Trump was sworn in on 20/01/2017
- For a long time, Trump was tweeting from his own Android phone - this seemed to completely stop around March 2017. Before that happened, we could draw some interesting insights from the app that the tweets came from
- Most of these charts show a full year, 03/08/2016 to 03/08/2017, unless shown or stated otherwise.
The chart below shows, at each point during the period, how many people the @RealDonaldTrump account was following:
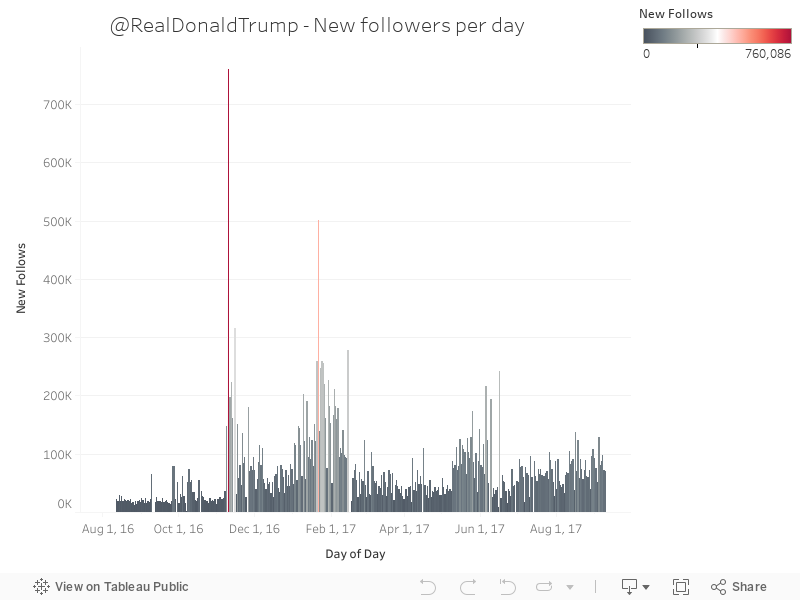
137 - New Trump followers per day
Charts 131 to 139 are a series of tweets from a spreadsheet I created that logs tweets from US President Donald Trump, and appends them with some other stats to create analysis. Some things you should know:
- All the charts are in United States Eastern Standard Time
- Sentiment analysis is approximate, but interesting
- The election was on 09/11/2016
- Trump was sworn in on 20/01/2017
- For a long time, Trump was tweeting from his own Android phone - this seemed to completely stop around March 2017. Before that happened, we could draw some interesting insights from the app that the tweets came from
- Most of these charts show a full year, 03/08/2016 to 03/08/2017, unless shown or stated otherwise.
- All the charts are in United States Eastern Standard Time
- Sentiment analysis is approximate, but interesting
- The election was on 09/11/2016
- Trump was sworn in on 20/01/2017
- For a long time, Trump was tweeting from his own Android phone - this seemed to completely stop around March 2017. Before that happened, we could draw some interesting insights from the app that the tweets came from
- Most of these charts show a full year, 03/08/2016 to 03/08/2017, unless shown or stated otherwise.
136 - New Trump followers per month
Charts 131 to 139 are a series of tweets from a spreadsheet I created that logs tweets from US President Donald Trump, and appends them with some other stats to create analysis. Some things you should know:
- All the charts are in United States Eastern Standard Time
- Sentiment analysis is approximate, but interesting
- The election was on 09/11/2016
- Trump was sworn in on 20/01/2017
- For a long time, Trump was tweeting from his own Android phone - this seemed to completely stop around March 2017. Before that happened, we could draw some interesting insights from the app that the tweets came from
- Most of these charts show a full year, 03/08/2016 to 03/08/2017, unless shown or stated otherwise.
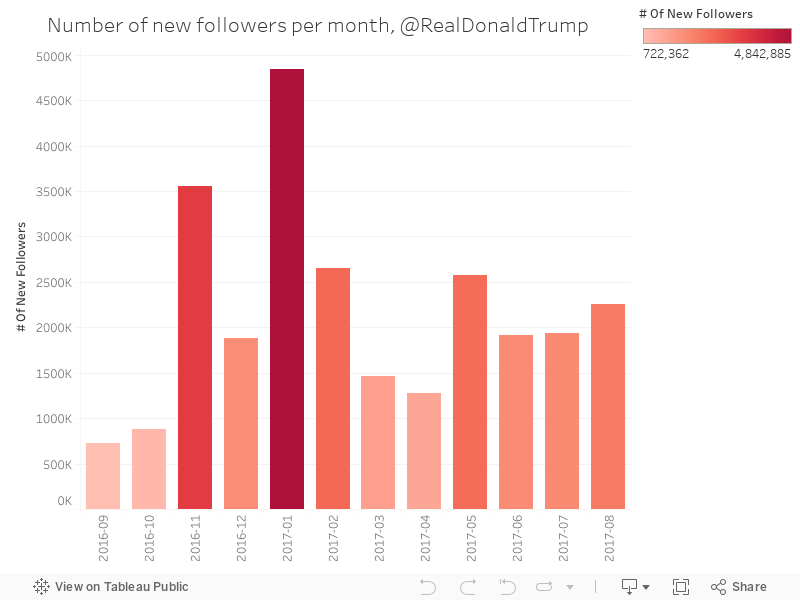
The chart below shows the number of new followers per month.
- All the charts are in United States Eastern Standard Time
- Sentiment analysis is approximate, but interesting
- The election was on 09/11/2016
- Trump was sworn in on 20/01/2017
- For a long time, Trump was tweeting from his own Android phone - this seemed to completely stop around March 2017. Before that happened, we could draw some interesting insights from the app that the tweets came from
- Most of these charts show a full year, 03/08/2016 to 03/08/2017, unless shown or stated otherwise.
The chart below shows the number of new followers per month.
135 - Trump's tweets by sentiment and month
Charts 131 to 139 are a series of tweets from a spreadsheet I created that logs tweets from US President Donald Trump, and appends them with some other stats to create analysis. Some things you should know:
- All the charts are in United States Eastern Standard Time
- Sentiment analysis is approximate, but interesting
- The election was on 09/11/2016
- Trump was sworn in on 20/01/2017
- For a long time, Trump was tweeting from his own Android phone - this seemed to completely stop around March 2017. Before that happened, we could draw some interesting insights from the app that the tweets came from
- Most of these charts show a full year, 03/08/2016 to 03/08/2017, unless shown or stated otherwise.
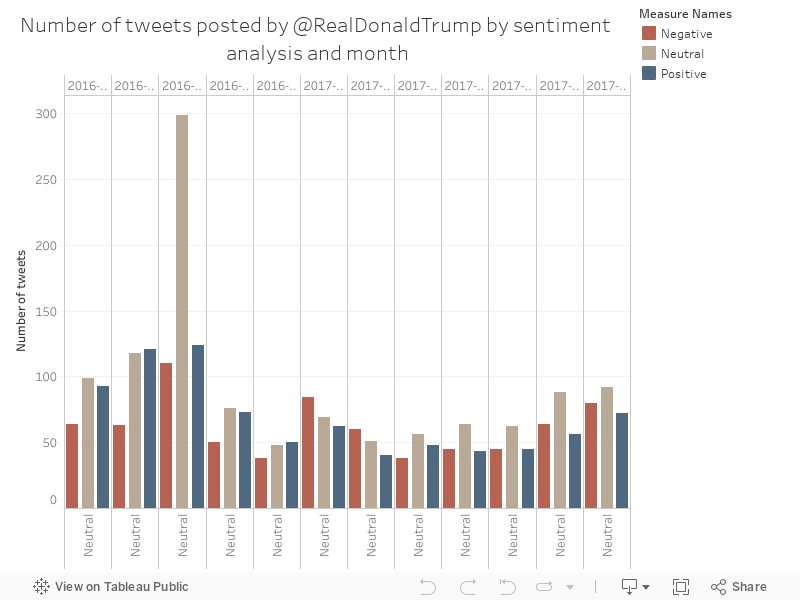
This chart shows an interesting shift in sentiment from January this year through to July, shifting from more negative tweets to more neutral ones.
- All the charts are in United States Eastern Standard Time
- Sentiment analysis is approximate, but interesting
- The election was on 09/11/2016
- Trump was sworn in on 20/01/2017
- For a long time, Trump was tweeting from his own Android phone - this seemed to completely stop around March 2017. Before that happened, we could draw some interesting insights from the app that the tweets came from
- Most of these charts show a full year, 03/08/2016 to 03/08/2017, unless shown or stated otherwise.
This chart shows an interesting shift in sentiment from January this year through to July, shifting from more negative tweets to more neutral ones.
134 - Trump's tweet by sentiment and app
Charts 131 to 139 are a series of tweets from a spreadsheet I created that logs tweets from US President Donald Trump, and appends them with some other stats to create analysis. Some things you should know:
- All the charts are in United States Eastern Standard Time
- Sentiment analysis is approximate, but interesting
- The election was on 09/11/2016
- Trump was sworn in on 20/01/2017
- For a long time, Trump was tweeting from his own Android phone - this seemed to completely stop around March 2017. Before that happened, we could draw some interesting insights from the app that the tweets came from
- Most of these charts show a full year, 03/08/2016 to 03/08/2017, unless shown or stated otherwise.
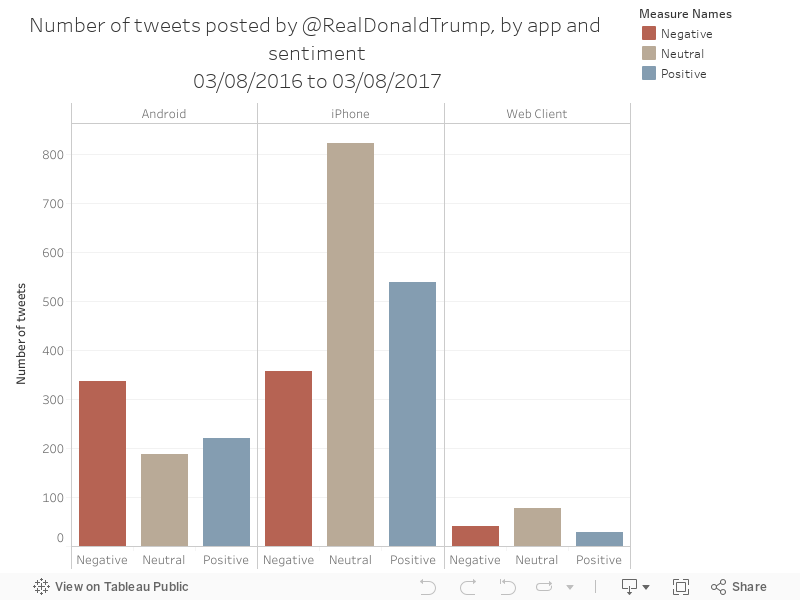
The chart below shows an interesting effect - tweets from android were more negative than tweets from iphone
- All the charts are in United States Eastern Standard Time
- Sentiment analysis is approximate, but interesting
- The election was on 09/11/2016
- Trump was sworn in on 20/01/2017
- For a long time, Trump was tweeting from his own Android phone - this seemed to completely stop around March 2017. Before that happened, we could draw some interesting insights from the app that the tweets came from
- Most of these charts show a full year, 03/08/2016 to 03/08/2017, unless shown or stated otherwise.
The chart below shows an interesting effect - tweets from android were more negative than tweets from iphone
Subscribe to:
Posts (Atom)