The data below come from a great, useful piece of software called NEM-Review, which shows generation data from machines on the east coast of Australia (WA's excluded)
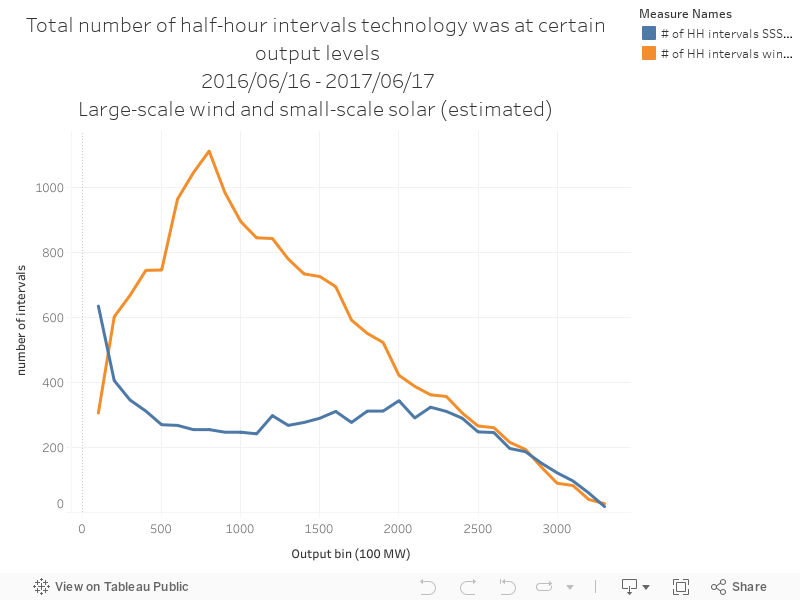
The chart below shows the output distribution for large-scale wind farms and rooftop solar PV. The data show the total number of half hour intervals that each technology spends at different levels of output.
The data below come from a great, useful piece of software called NEM-Review, which shows generation data from machines on the east coast of Australia (WA's excluded)
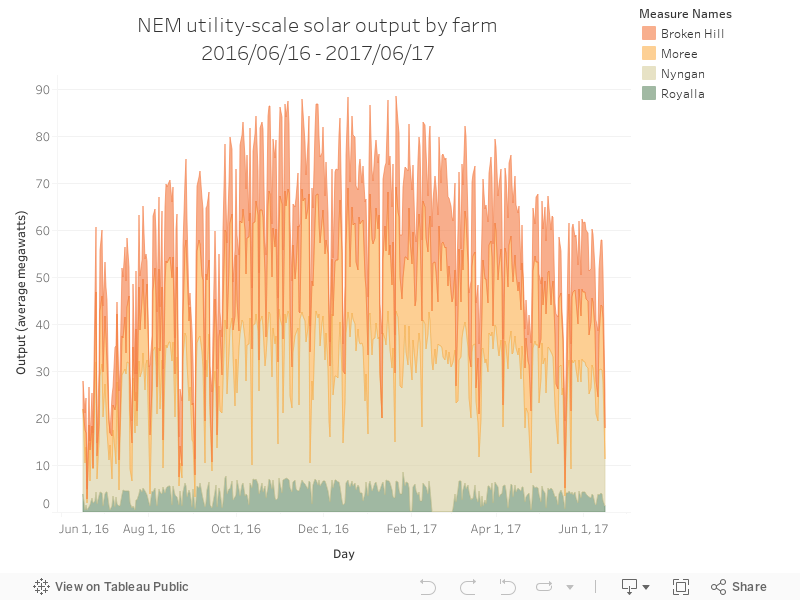
The chart below shows the total output of large-scale solar PV output, showing average megawatt output by day.
The data below come from a great, useful piece of software called NEM-Review, which shows generation data from machines on the east coast of Australia (WA's excluded)
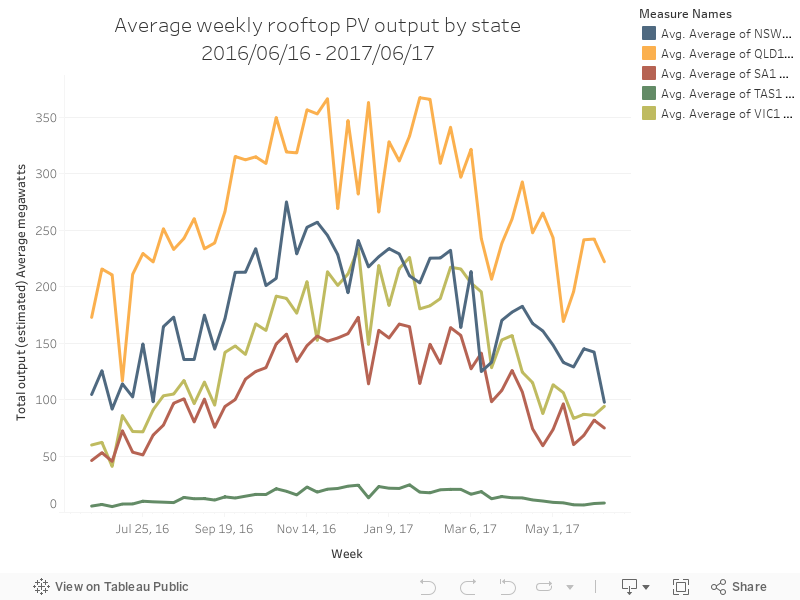
The chart below shows estimated rooftop PV by state - the estimations of rooftop PV output come from a tool that estimates generation from a map of suburb installations.
The data below come from a great, useful piece of software called NEM-Review, which shows generation data from machines on the east coast of Australia (WA's excluded)
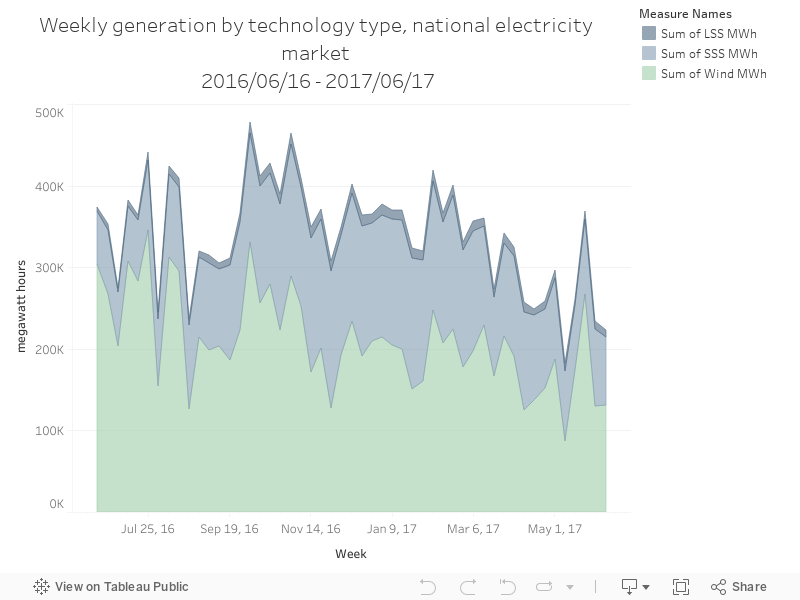
The chart below shows the total output of each fuel type by week, for those renewable energy generators on the NEM.
The data below come from a great, useful piece of software called NEM-Review, which shows generation data from machines on the east coast of Australia (WA's excluded).
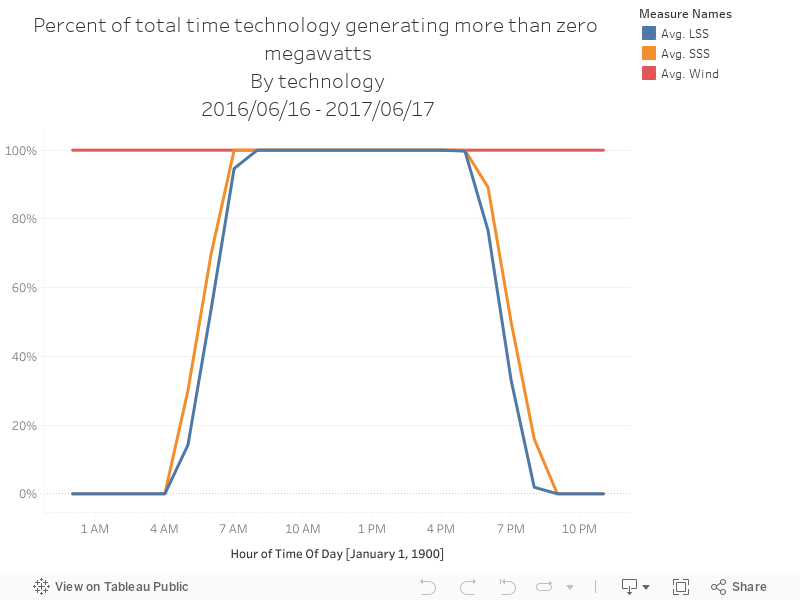
The chart below shows the percentage of time each technology was generating more than zero megawatts, shown by each one-hour block in the day.
The data below come from a great, useful piece of software called NEM-Review, which shows generation data from machines on the east coast of Australia (WA's excluded)
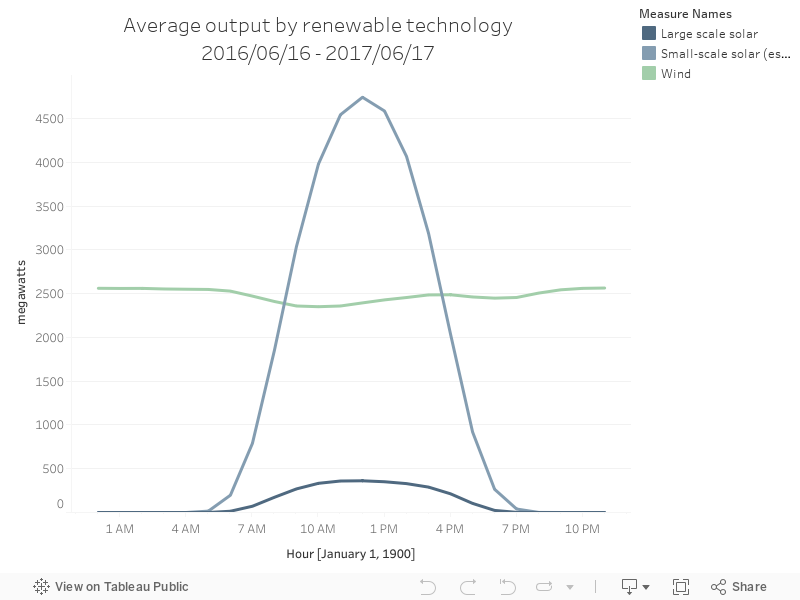
The chart below shows the daily output of Australian renewable energy technologies, by average megawatts of output.
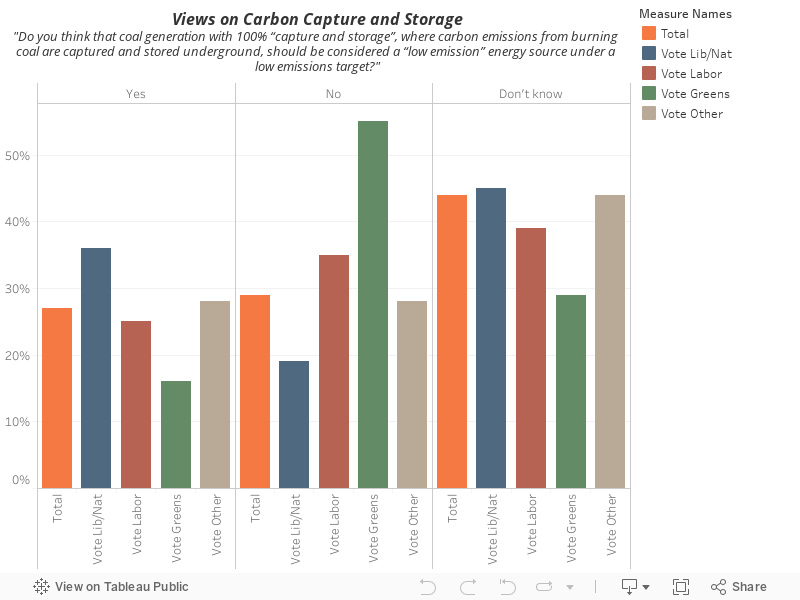
Essential vision polled survey respondents about carbon capture and storage - the 'don't knows' dominate and there's an expected political voting divide on views on the technology. This is a very hot issue at the moment, with the Minerals Council of Australia urging the Australian government to use taxpayer funds to build new coal-fired power stations.