Some recent news - the Australian Government Department of Energy recently
released the 'National Greenhouse Gas Inventory' - a big, all-encompassing update of exactly how much Australia is emitting into the Earth's atmosphere through the operation of our economy. There'a whole stack of data in the December 2016 update.
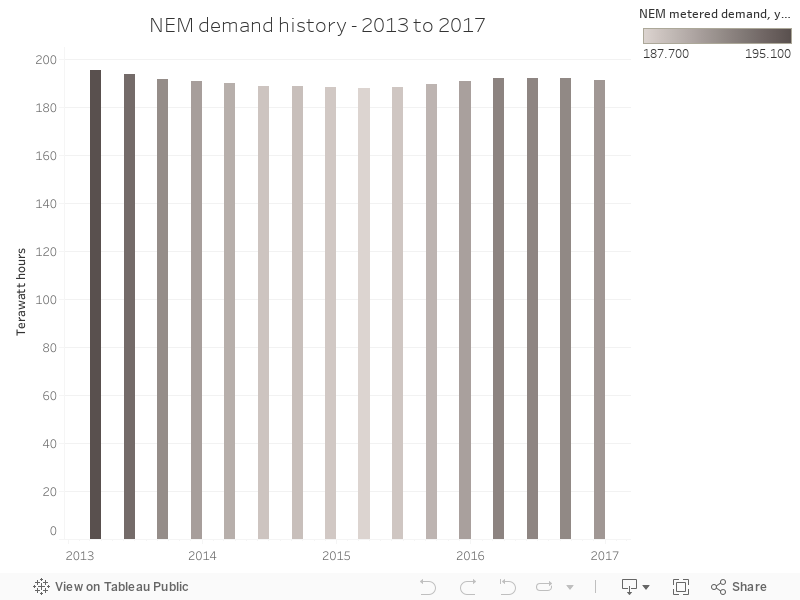
This chart answers the question - is demand going up or down? Of course, the answer is 'sort of both' - it's been relatively steady since 2015.
No comments:
Post a Comment