Charts 106 through to 115 will be a series based on data from the United States Energy Information administration, with 108 to 115 focusing on solar thermal power stations in the US (South Australia just had an announcement about a big new
solar thermal power station).
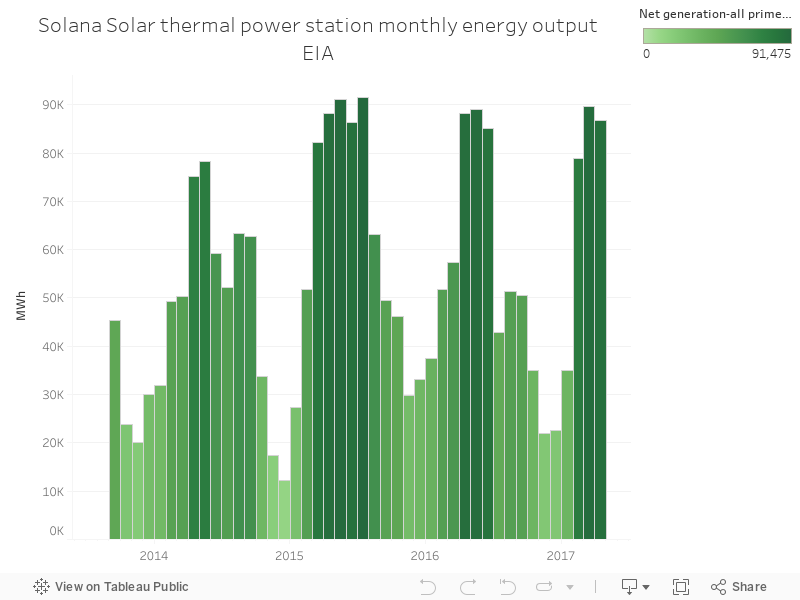
Solana solar thermal power station in the US uses a parabolic trough - mirrors pointed at a pipe - instead of concentrating sunlight using mirrors on a single receiver. The chart below shows monthly output for the power station going back to the start of operation.
No comments:
Post a Comment