Charts 116 through to 120 are a series from the Australian Energy Market Operator's South Australian Fuel and Technology Report, 2017, which can be accessed
here.
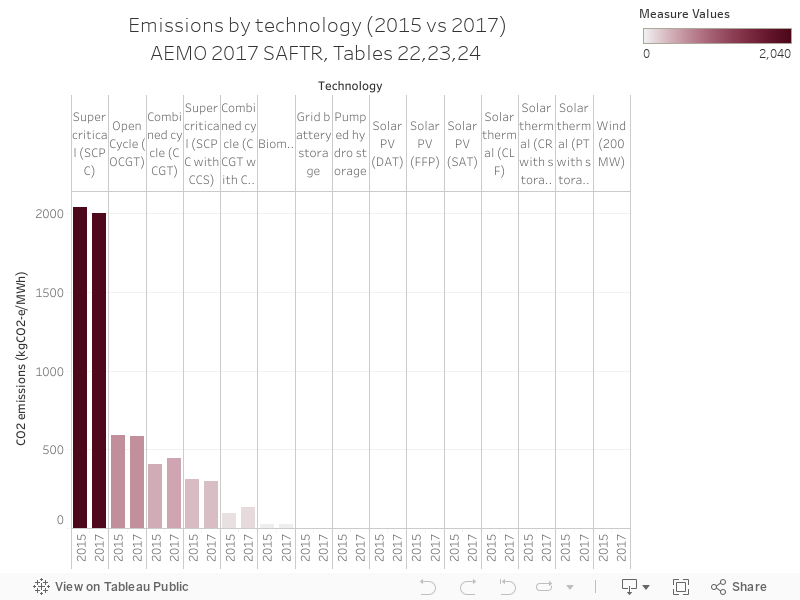
Today's chart shows emissions intensity for every unit of ouput by technology, with super-critical coal at the top of the the list.
No comments:
Post a Comment