Charts 106 through to 115 will be a series based on data from the United States Energy Information administration, with 108 to 115 focusing on solar thermal power stations in the US (South Australia just had an announcement about a big new
solar thermal power station).
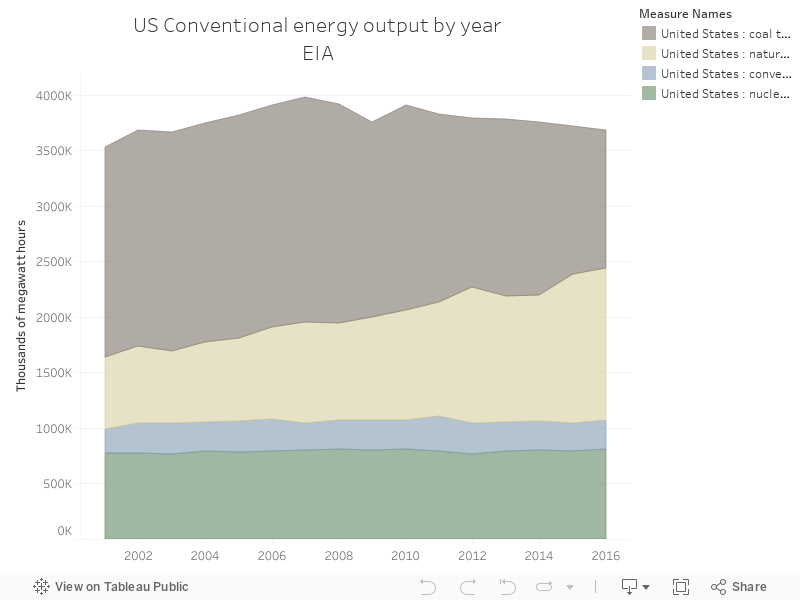
Today's chart - the early output of all non-renewable, non-hydro power stations from 2001. Simply, coal is phasing out and the gap is being filled by gas.
No comments:
Post a Comment