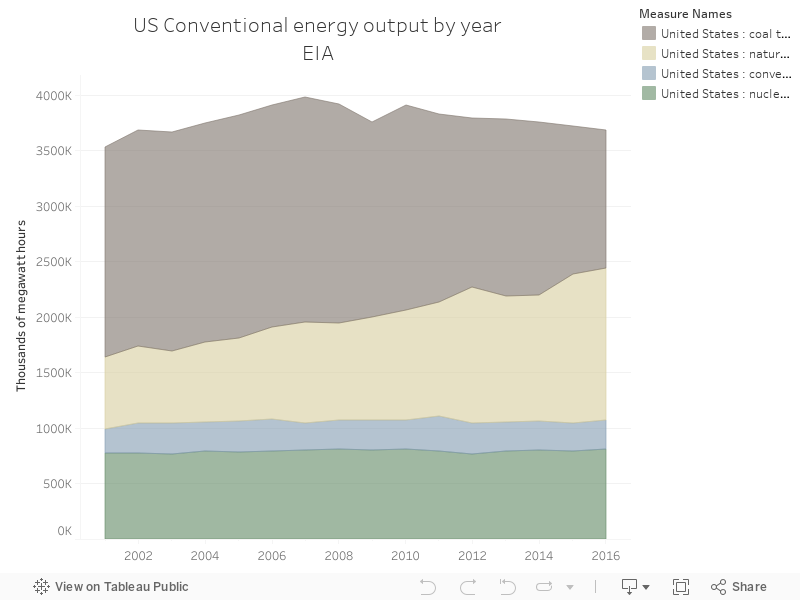
Today's chart - the early output of all non-renewable, non-hydro power stations from 2001. Simply, coal is phasing out and the gap is being filled by gas.
Wednesday, 23 August 2017
107 - US output - all fuels
Charts 106 through to 115 will be a series based on data from the United States Energy Information administration, with 108 to 115 focusing on solar thermal power stations in the US (South Australia just had an announcement about a big new solar thermal power station).
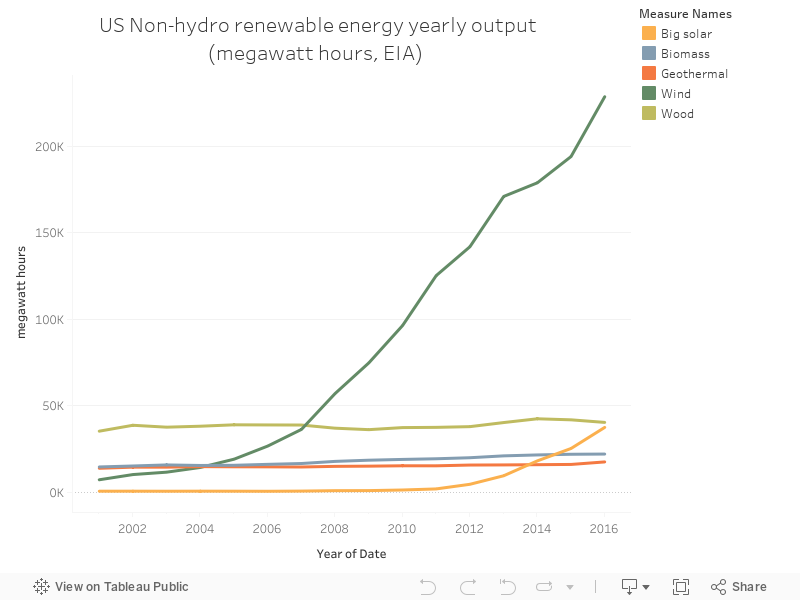
106 - US renewable energy output
Charts 106 through to 115 will be a series based on data from the United States Energy Information administration, with 108 to 115 focusing on solar thermal power stations in the US (South Australia just had an announcement about a big new solar thermal power station).
Today's chart shows the yearly output of US' non-hydro renewable power stations - with wind and big solar being to big standouts in terms of increases
Sunday, 13 August 2017
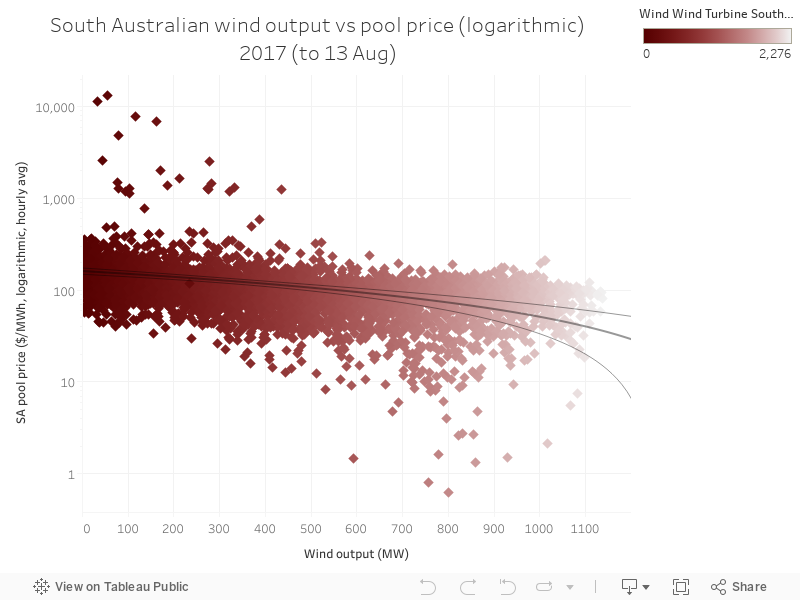
105 - Higher wind output in SA correlates with lower wholesale price
This week, a series on South Australia - all using data from Global Roam's excellent NEM Review software, which you can purchase here.
Today's chart is similar to yesterday's - it shows the relationship between wind power output and wholesale price in South Australia. Unlike yesterday's chart on gas, wind has the opposite effect - as you get more wind power output in each interval, the price ends up lower. This is because wind introduces more competition, has no fuel costs, and also receives revenue from the Renewable Energy Target (RET) scheme - all of these factors mean wind's increasing output results in lower wholesale price in SA.
This is good, but obviously the impact varies with wind power output in the state. Once wind starts being paired with firming output - including storage technologies - we're going to see some very big changes in this dynamic. Obviously, wind will be slightly more expensive, but at the same time, it'll be dispatchable - and perhaps, as battery costs fall, it might end up even cheaper. Good times.
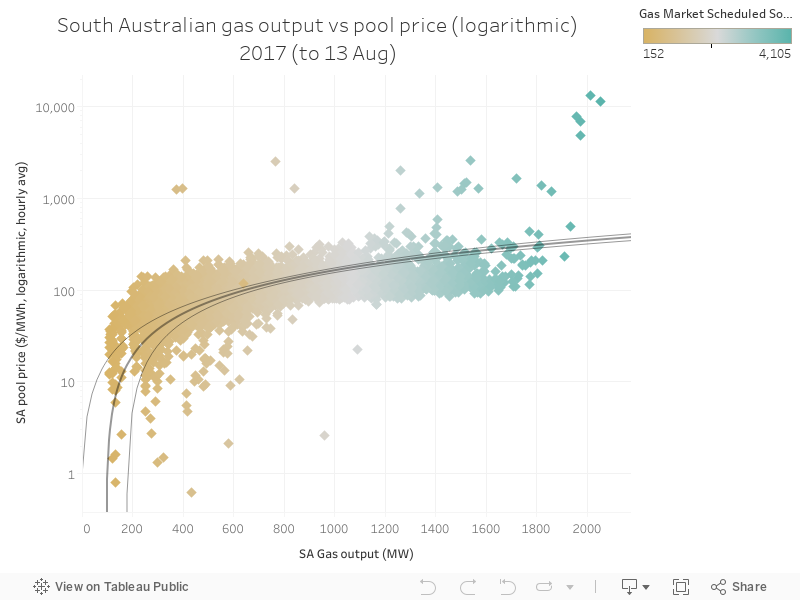
104 - Higher gas output in SA correlates with higher wholesale price
This week, a series on South Australia - all using data from Global Roam's excellent NEM Review software, which you can purchase here.
Today's chart shows the relationship between the output of gas-fired power stations in South Australia, and the wholesale pool price in the same state. The data below show a scatter plot between gas and price for ever hour in 2017, and it illustrates the simple fact that as gas power increases penetration in the state, the pool price is higher. This is because price is set by a bidding system, and the final bidder sets the price. Gas has something of a monopoly in the state, in addition to the fuel costs being high because gas is mostly exported (leaving domestic reserves more expensive).
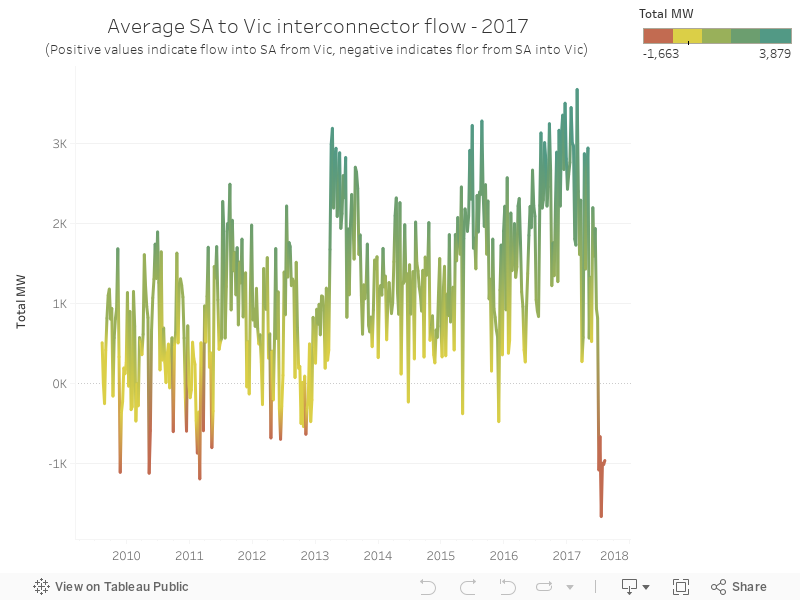
103 - SA's significant shift to exporting to Victoria
This week, a series on South Australia - all using data from Global Roam's excellent NEM Review software, which you can purchase here.
Today's chart shows the net flow across South Australia's two interconnectors (Heywood and Murraylink), and how, in recent weeks, there's been a fairly significant shift in that flow - South Australia is now exporting a fair percentage of its power to Victoria. The state hasn't exported this amount since at least 2010, and if you go back further I suspect its been quite some time since the level of net export was sustained at this level.
This is largely related to a big upswing in wind power output, which is also at historically high levels (as is often the case in June / July).
102 - South Australia's wholesale price changes in 2017
This week, a series on South Australia - all using data from Global Roam's excellent NEM Review software, which you can purchase here.
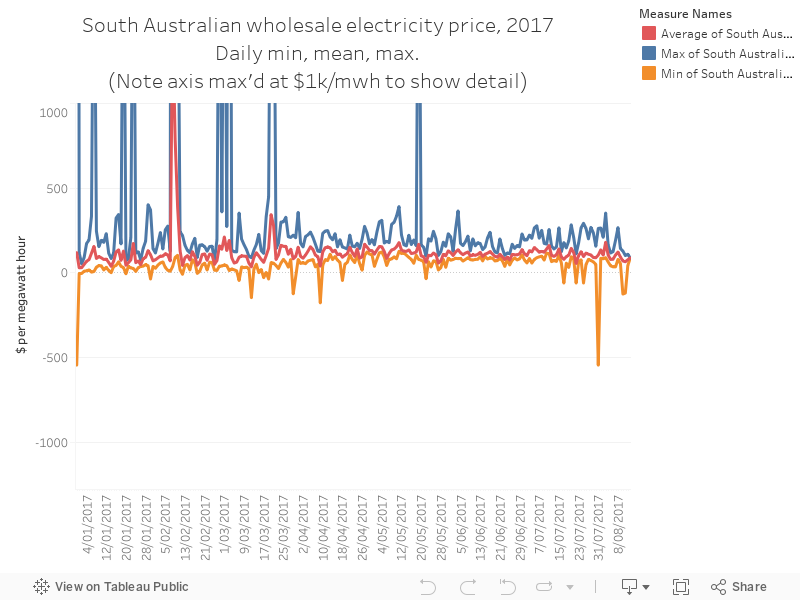
Today's chart shows the daily minimum, mean and maximum (the chart cuts off at $1,000 per megawatt hour to give us a better view of what's going on at lower price levels) wholesale electricity price in South Australia. Wholesale isn't the whole story - you also pay network, retail and environmental charges on your bill, and often fluctuations in these tell a more complete story about what you pay every quarter.
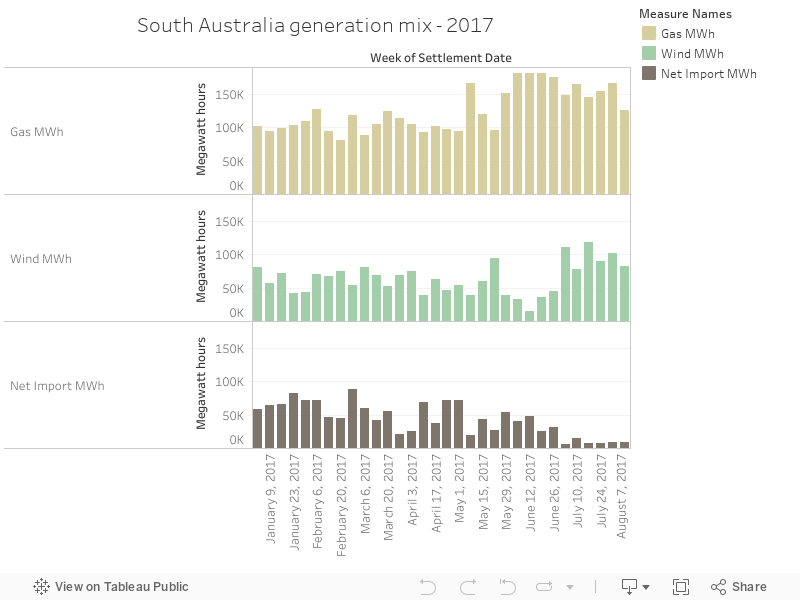
The chart below shows how there's been a slight dip as wind power has increased output in July (as you can see in yesterday's chart), and how prices were higher when gas dominated the fuel mix in the state. You can also see the prevalence of price spikes above $1k/MWh in summer, which is pretty normal.
101 - South Australia's shifting fuel mix
This week, a series on South Australia - all using data from Global Roam's excellent NEM Review software, which you can purchase here.
Today's chart is a simple illustration of shifts in the fuel mix so far - interestingly, after a low-wind month in June, July's high wind output means very little reliance on Victorian imports and lower exposure to high-priced gas in SA. This illustrates the advantages of wind power but it also shows the un-realised further benefits of firmed wind power - once you start dispatching low-cost resource, it'll reduce reliance on Victoria, add grid stability and also, quite importantly, reduce the amount of gas being dispatched in the state, resulting in (presumably) lower prices.
Subscribe to:
Posts (Atom)